Products
AI Platform
Asana Foundations
Company Type
In This Article
Visit our pricing page for more information.
Available on Asana Advanced, Enterprise, and Enterprise+ tiers, as well as legacy tiers Business, and Legacy Enterprise.
Portfolio dashboards provide a comprehensive view of your portfolio's performance, allowing you to track progress, identify trends, and make data-driven decisions across multiple projects. This powerful feature enables you to visualize key metrics and insights through various chart types, helping you to effectively manage and optimize your portfolio's performance.
Portfolio dashboards extend the power of Asana's reporting capabilities to the portfolio level. They allow you to create custom visualizations of your portfolio data, helping you to understand the overall health and progress of your initiatives.
To create a portfolio dashboard:
Navigate to your portfolio
Click on the Dashboard tab
Click + Add chart
You can choose from various chart types, including:
Learn more about the chart styles you can choose from.
With portfolio dashboards, you can choose to report on Tasks, Projects, or Portfolios.
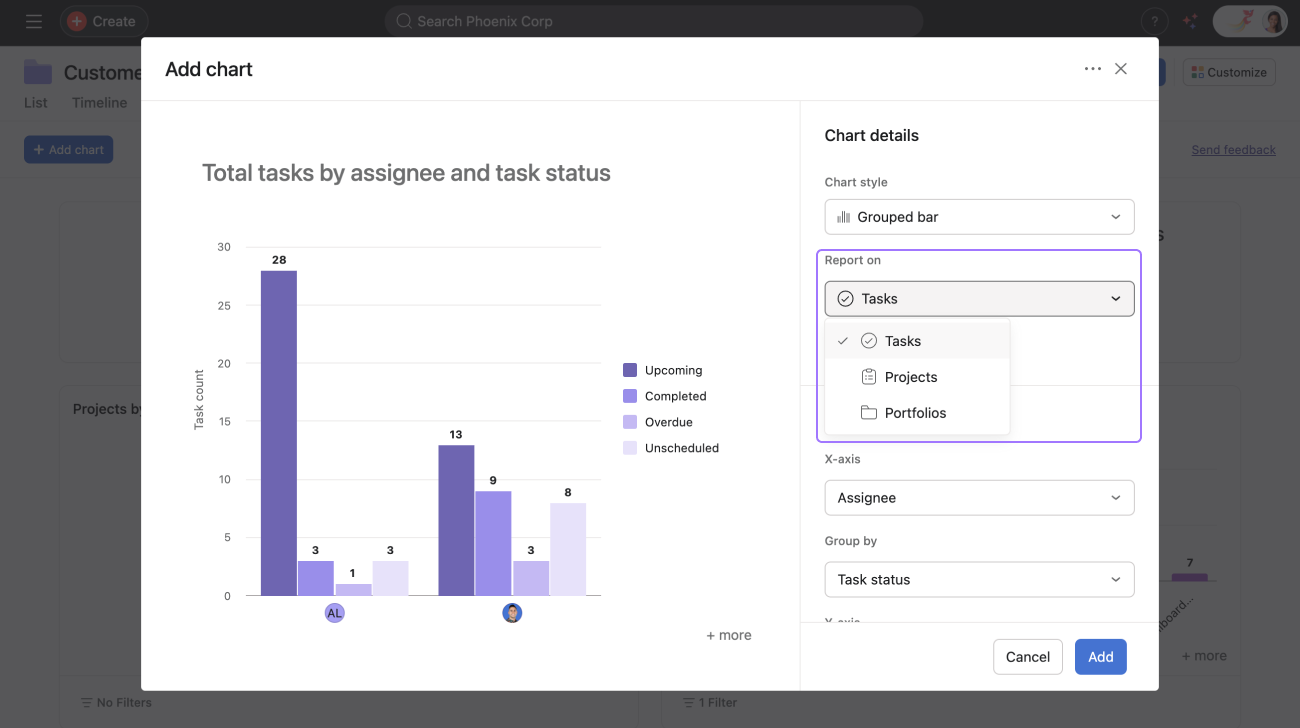
Then, you can choose your X-axis, Y-axis and depending on the chart Group by.
Once you’ve finished customizing your chart, click Add.