Products
AI Platform
Asana Foundations
Company Type
Visit our pricing page for more information.
Available on Asana Advanced, Enterprise, and Enterprise+ tiers, as well as legacy tiers Business and Legacy Enterprise.
Visit our pricing page for more information.
Portfolios provide an overview of your projects' progress within the portfolio, allowing you to share timely updates with your team through status updates and create dashboards using real-time data.
This article explains how to leverage status updates and dashboards in portfolios to visualize data and communicate insights effectively.
The portfolio progress section gives you an in-depth snapshot into the status of any portfolio you’re working on. Status reports make it easy to create rich status updates and share your work with key stakeholders.
When you click the Progress tab in your portfolio, you’ll see a snapshot of your portfolio’s current progress status.
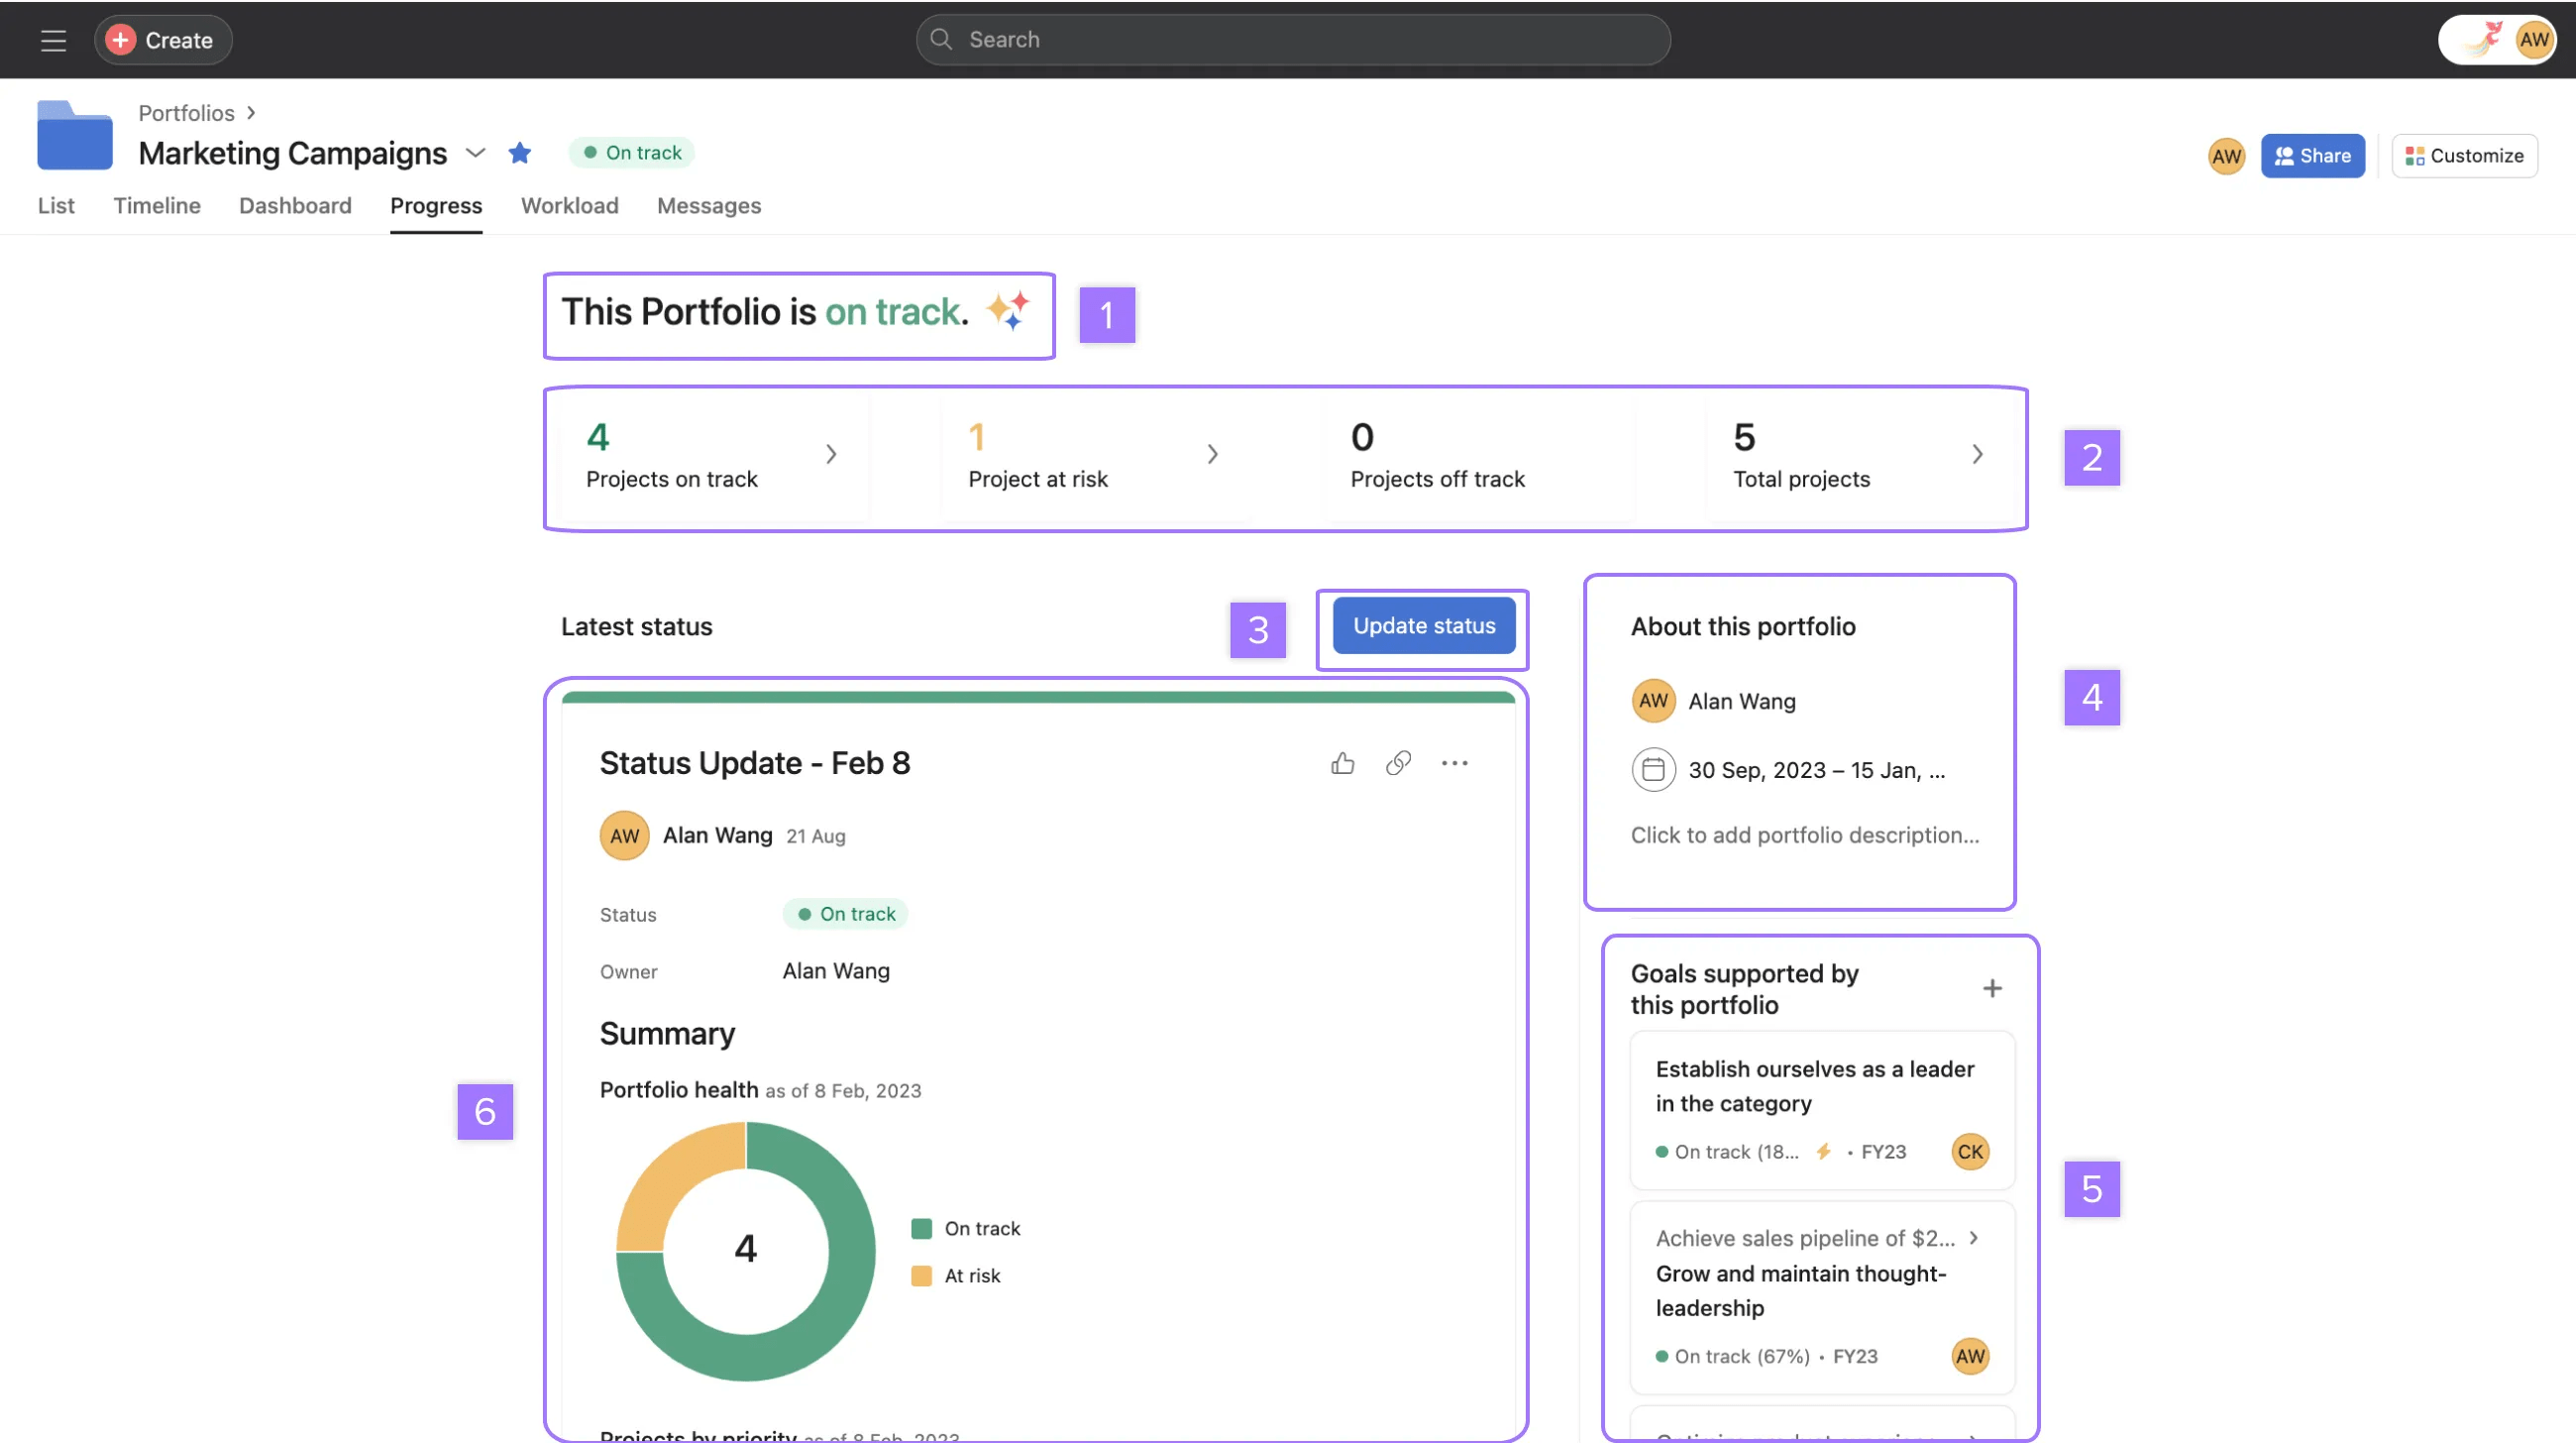
You can update your portfolio's status at any time. The templatized block structure allows you to incorporate the actual work being done in Asana with narrative context to explain the status of work.
To create a new status update, click Set status next to the portfolio's name, or navigate to the Progress tab and click Update status.
Note
You must select a portfolio status of on track, at risk, off track, or on hold and at least one block of text before you can post a portfolio status update.
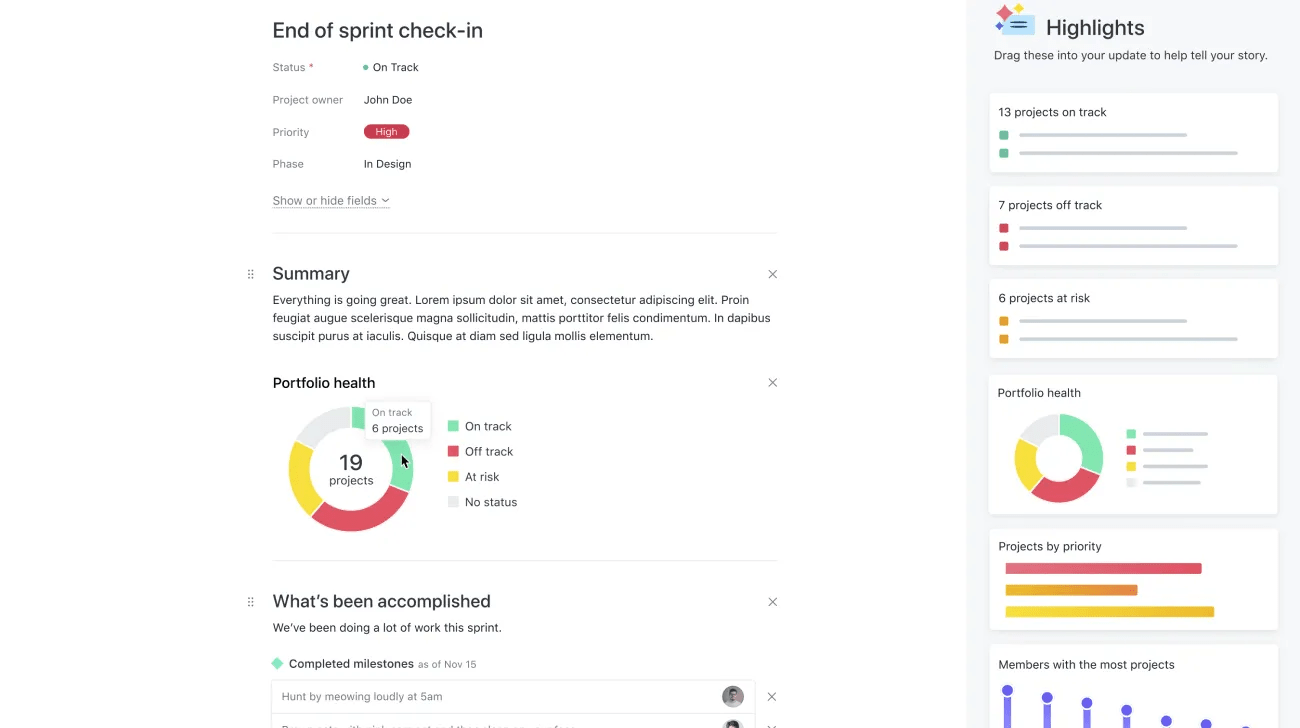
You can drag and drop highlights such as projects that are on track or at risk into your status update to help tell your story. Adding these highlights gives a visual insight into recent achievements or potential blockers for your team.
Once you’ve added your highlights and published your status update, Asana will remember the block structure and ordering for future updates.
You can reorder your What we’ve accomplished, What's blocked, and Next steps section by dragging and dropping them.
Adding charts to your status updates gives a visual insight into the work being done across your team. You can drag and drop your chart blocks into your status update.
You can add collaborators to a status update that might not have access to the project; they can see all of the content of the update, but if they click on a project highlight or element they don’t have access to, their access will be denied.
Public portfolio status updates will be fully visible in the progress tab, even if users don’t have access to all projects in the portfolio.
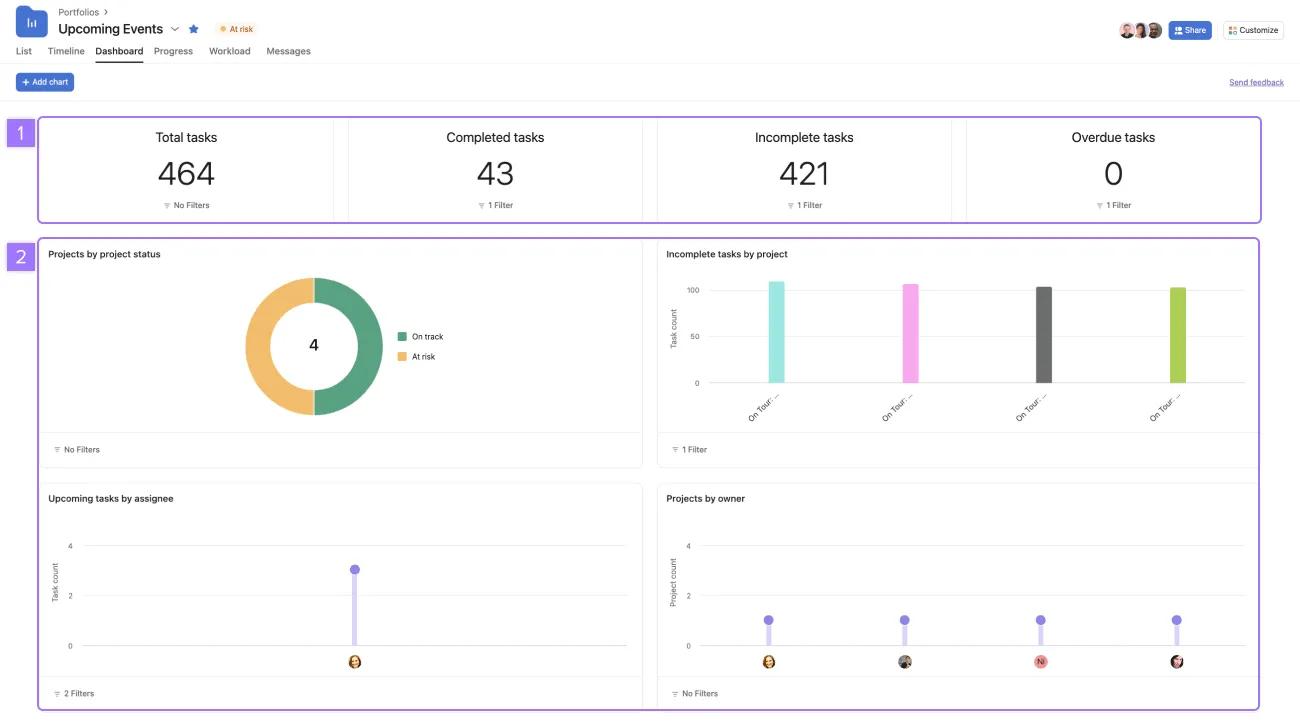
Click the Dashboard tab in your portfolio to view charts to understand your team’s progress quickly.
By default, portfolio dashboards include preset charts to get you started, but you can add, remove, or customize them as needed. The charts will automatically populate when you first land on the dashboard tab and will automatically update every time you visit the tab or refresh the page, so you know the information is current.
Portfolio dashboards are prefiltered to include only data from your selected portfolio, including tasks and data from nested portfolios.
Portfolio dashboards show data based on the permissions of the viewer. Viewers without access to all the data in portfolios may see an incomplete data set on dashboards. Learn more about portfolio privacy settings.
View tasks by project to understand where efficiencies and potential bottlenecks are in your team’s process. Or swap in any of your custom fields to see how they compare.
Get a quick pulse on your projects by status and each status slice's size. You can see if your incomplete projects are a tiny or large piece of the pie.
Understand how work is distributed across your team. Quickly see who has been excelling and who might be overloaded.
Get a quick overview of the number of projects each person on your team owns to gain visibility into their workload and bandwidth.
Learn more about the different types of charts you can use in our Reporting article.
You can create charts based on portfolio metadata within universal reporting, allowing you to report on portfolios, tasks, and projects.
To create a portfolio chart, navigate to the Dashboard tab and click + Add chart.
Portfolio rollups are migrating to formula custom fields. Previously, portfolio rollups allowed you to add view-only custom fields to your portfolios. Now you can create tailored data aggregations within portfolios as this migration combines the power of portfolio rollups with the flexibility of formula custom fields.
Rollups sum up the numeric data of global custom fields or time tracking fields that are present in the portfolio's projects, allowing you to keep track of underlying data in your projects without navigating away from the portfolio.
The field title must differ from the name of the field within the projects. In the example above, the field that has been added to the projects is titled “Effort”, so the portfolio field title here is “Effort Rollup”.
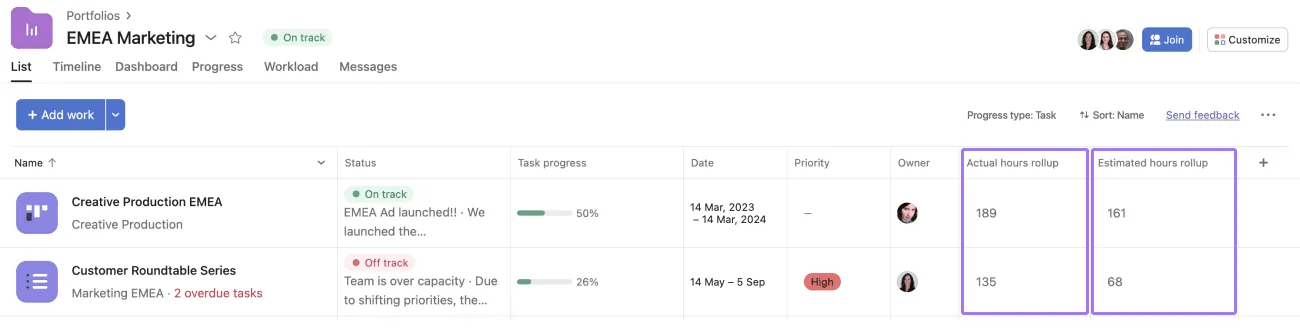
This example shows the numeric custom fields Actual hours and Estimated hours, but any numeric custom field can become a portfolio rollup.