Products
AI Platform
Asana Foundations
Company Type
Visit our pricing page for more information.
Available on Asana Starter, Advanced, Enterprise, and Enterprise+ tiers, and legacy tiers Premium, Business and Legacy Enterprise.
Visit our pricing page for more information.
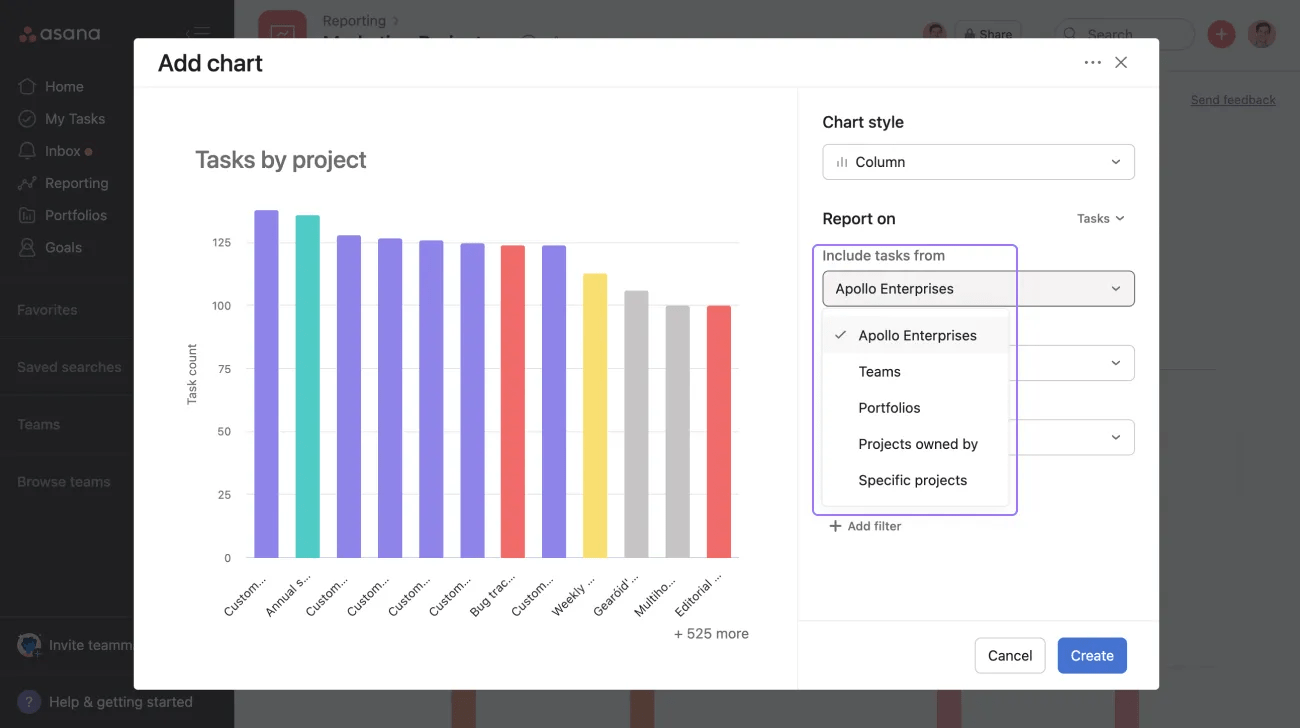
Universal reporting allows you to consume and translate data in a visual format. People in your organization can combine charts in dashboard views to get a quick overview of the metrics they care about most. With universal reporting, getting an accurate picture of what is happening in your team is easy, helping you align your team around clear objectives and prioritizing work.
Join our Gaining insights with Reporting virtual training to learn more about reporting effectively in Asana. Register now.
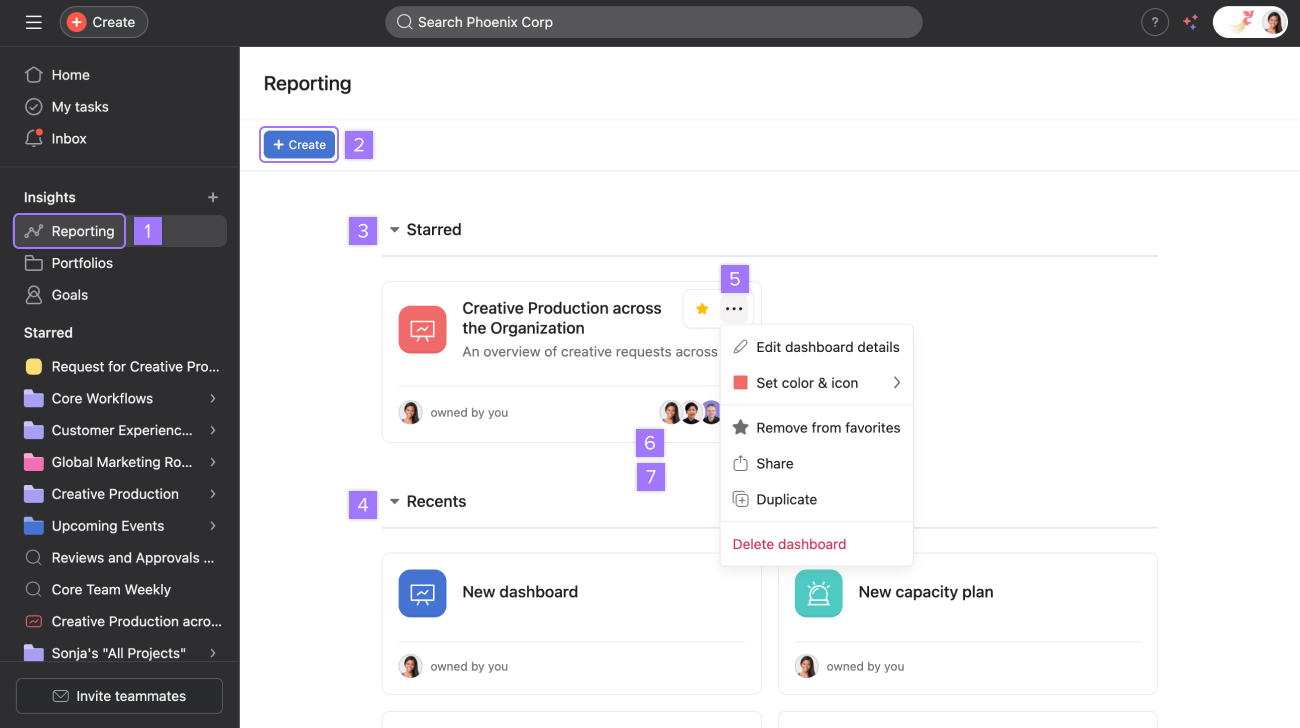
Dashboards serve as a central place to view charts. You can create and include charts that report on various data points such as tasks, projects, portfolios, and goals.
For time period, the clock starts when the time custom field is added to the task and stops when either the task is completed or the time custom field is removed from the task.
Note
You can only group global custom fields.
Time added by and Time entry will only become available when you've added time tracking fields to your project.
The ability to group by "time to complete" is only available for tasks and customers on Asana Enterprise and Enterprise+ tiers, and legacy tiers Business and Legacy Enterprise.
Creating charts on project metadata is available on Asana Advanced, Enterprise and Enterprise+ tiers, and legacy tiers Business and Legacy Enterprise.
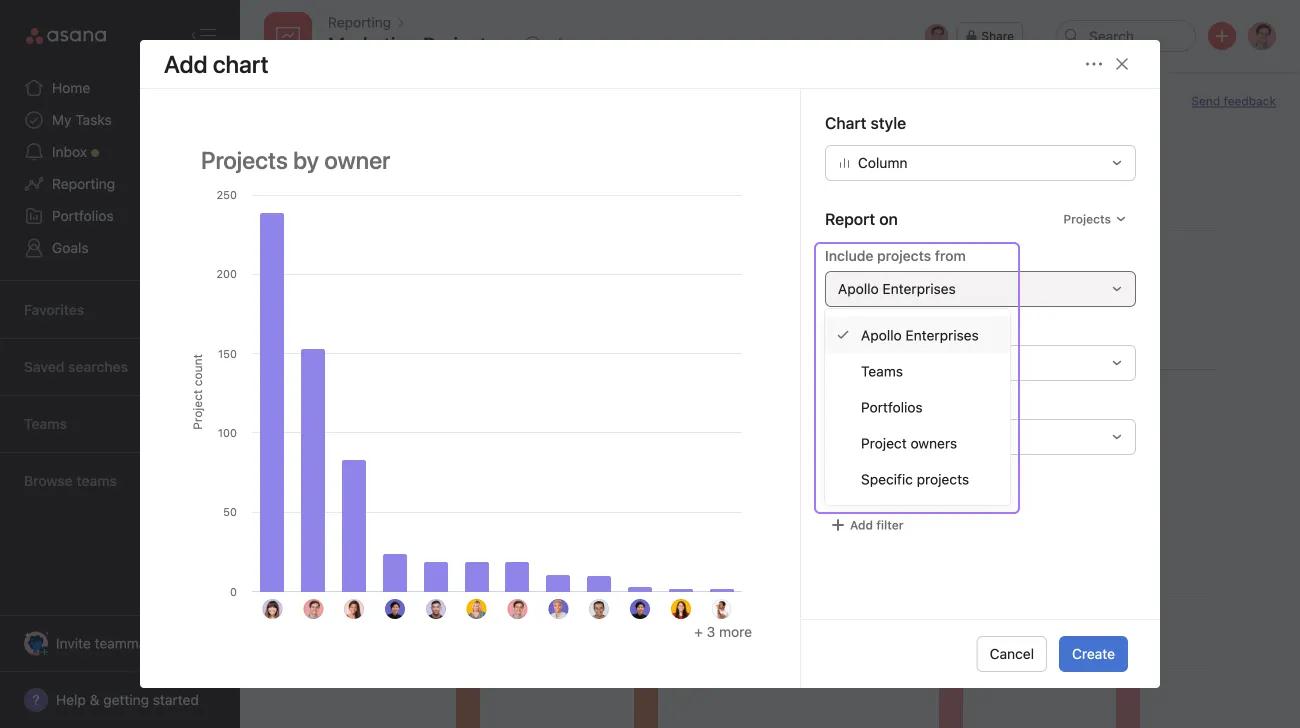
Creating charts on projects will allow you to understand, track, and compare important data across projects, portfolios, and teams.
To create charts on project metadata, select Report on Projects.
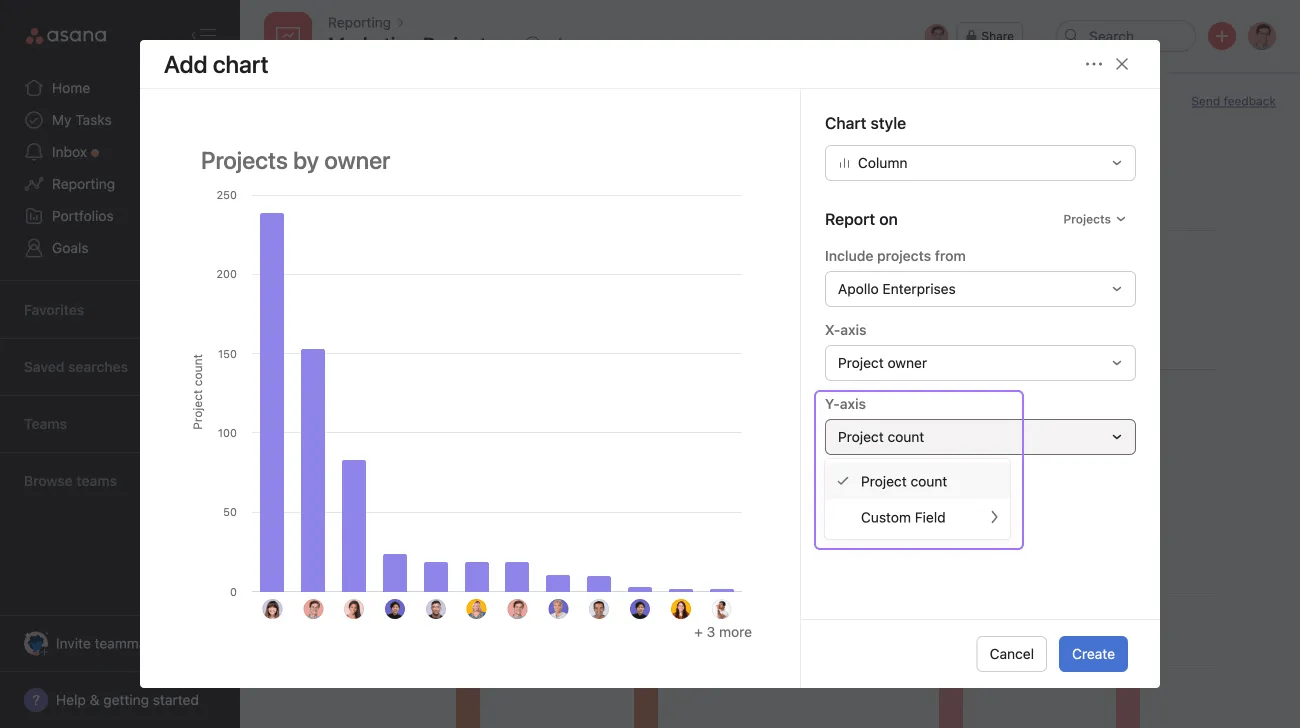
You can measure either by project count or numeric custom field.
Group by project count when you want to compare numeric custom field values.
Creating charts on goal metadata is available on Asana Advanced, Enterprise and Enterprise+ tiers, as well as legacy tiers Business and Legacy Enterprise.
Creating charts on goals will help you track their performance across your organization and provide insights into their health.
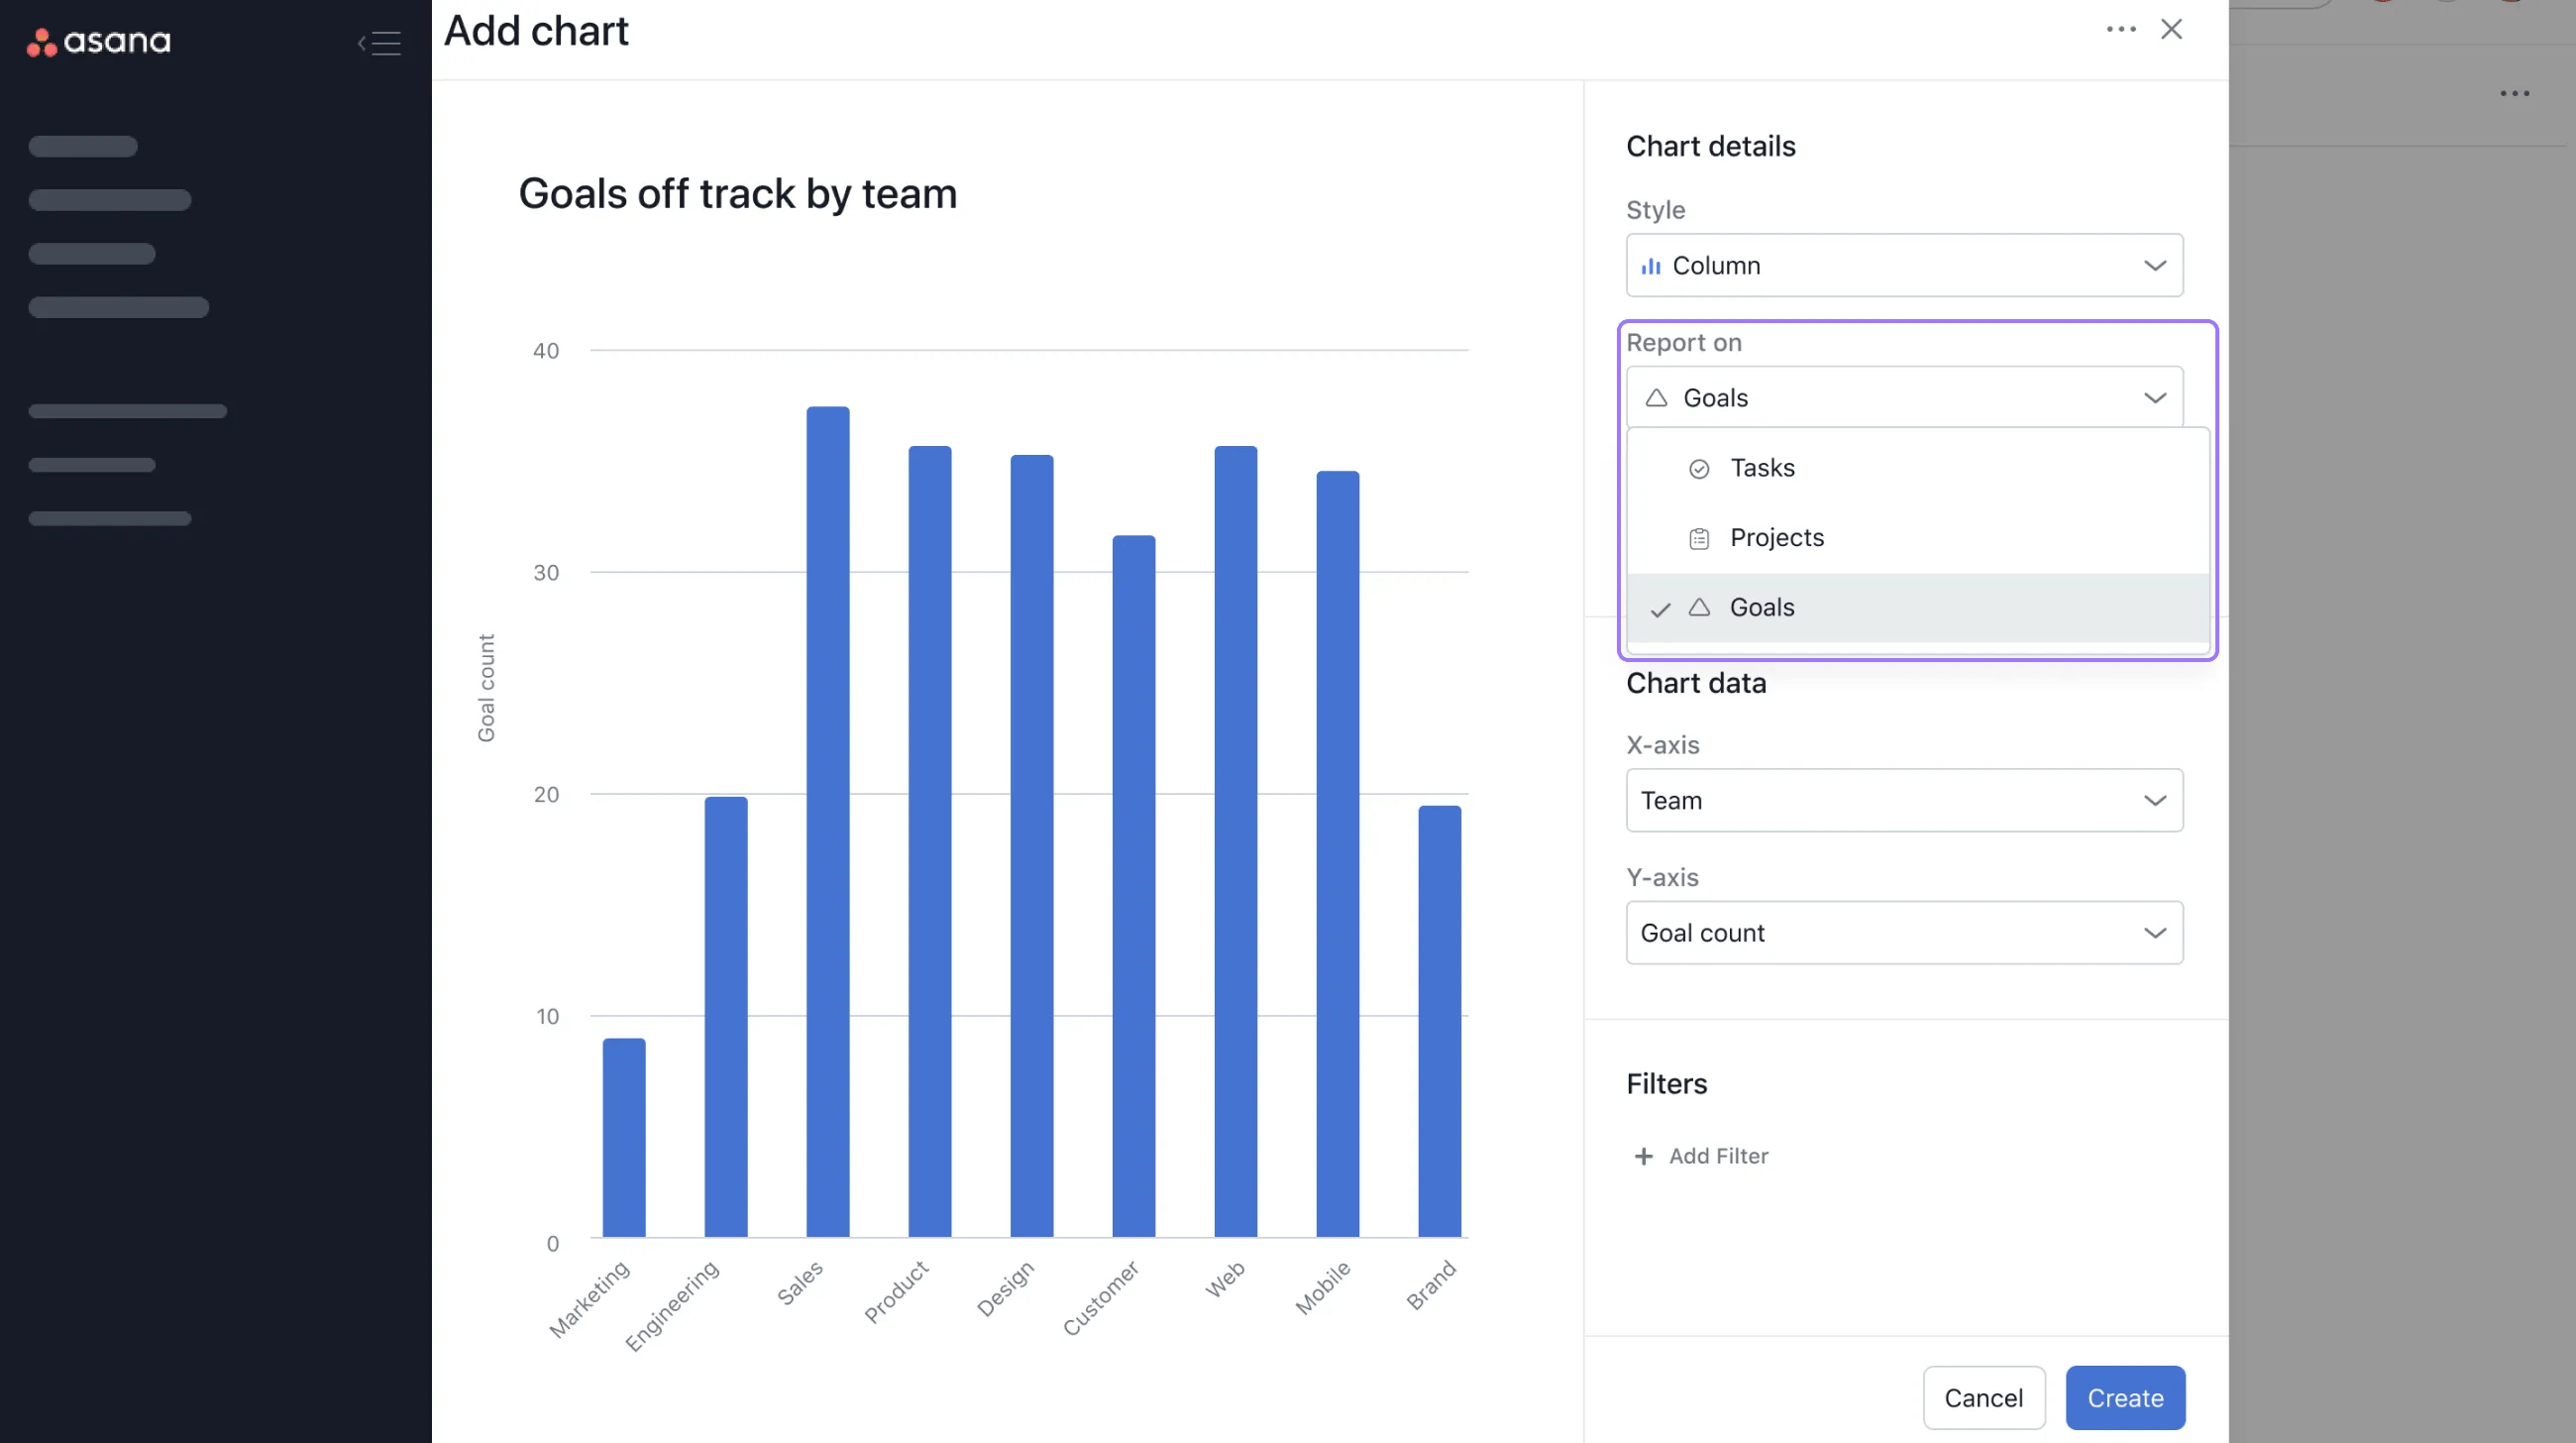
To create charts on goal metadata, select Report on Goals.

From Goal type, you can select:
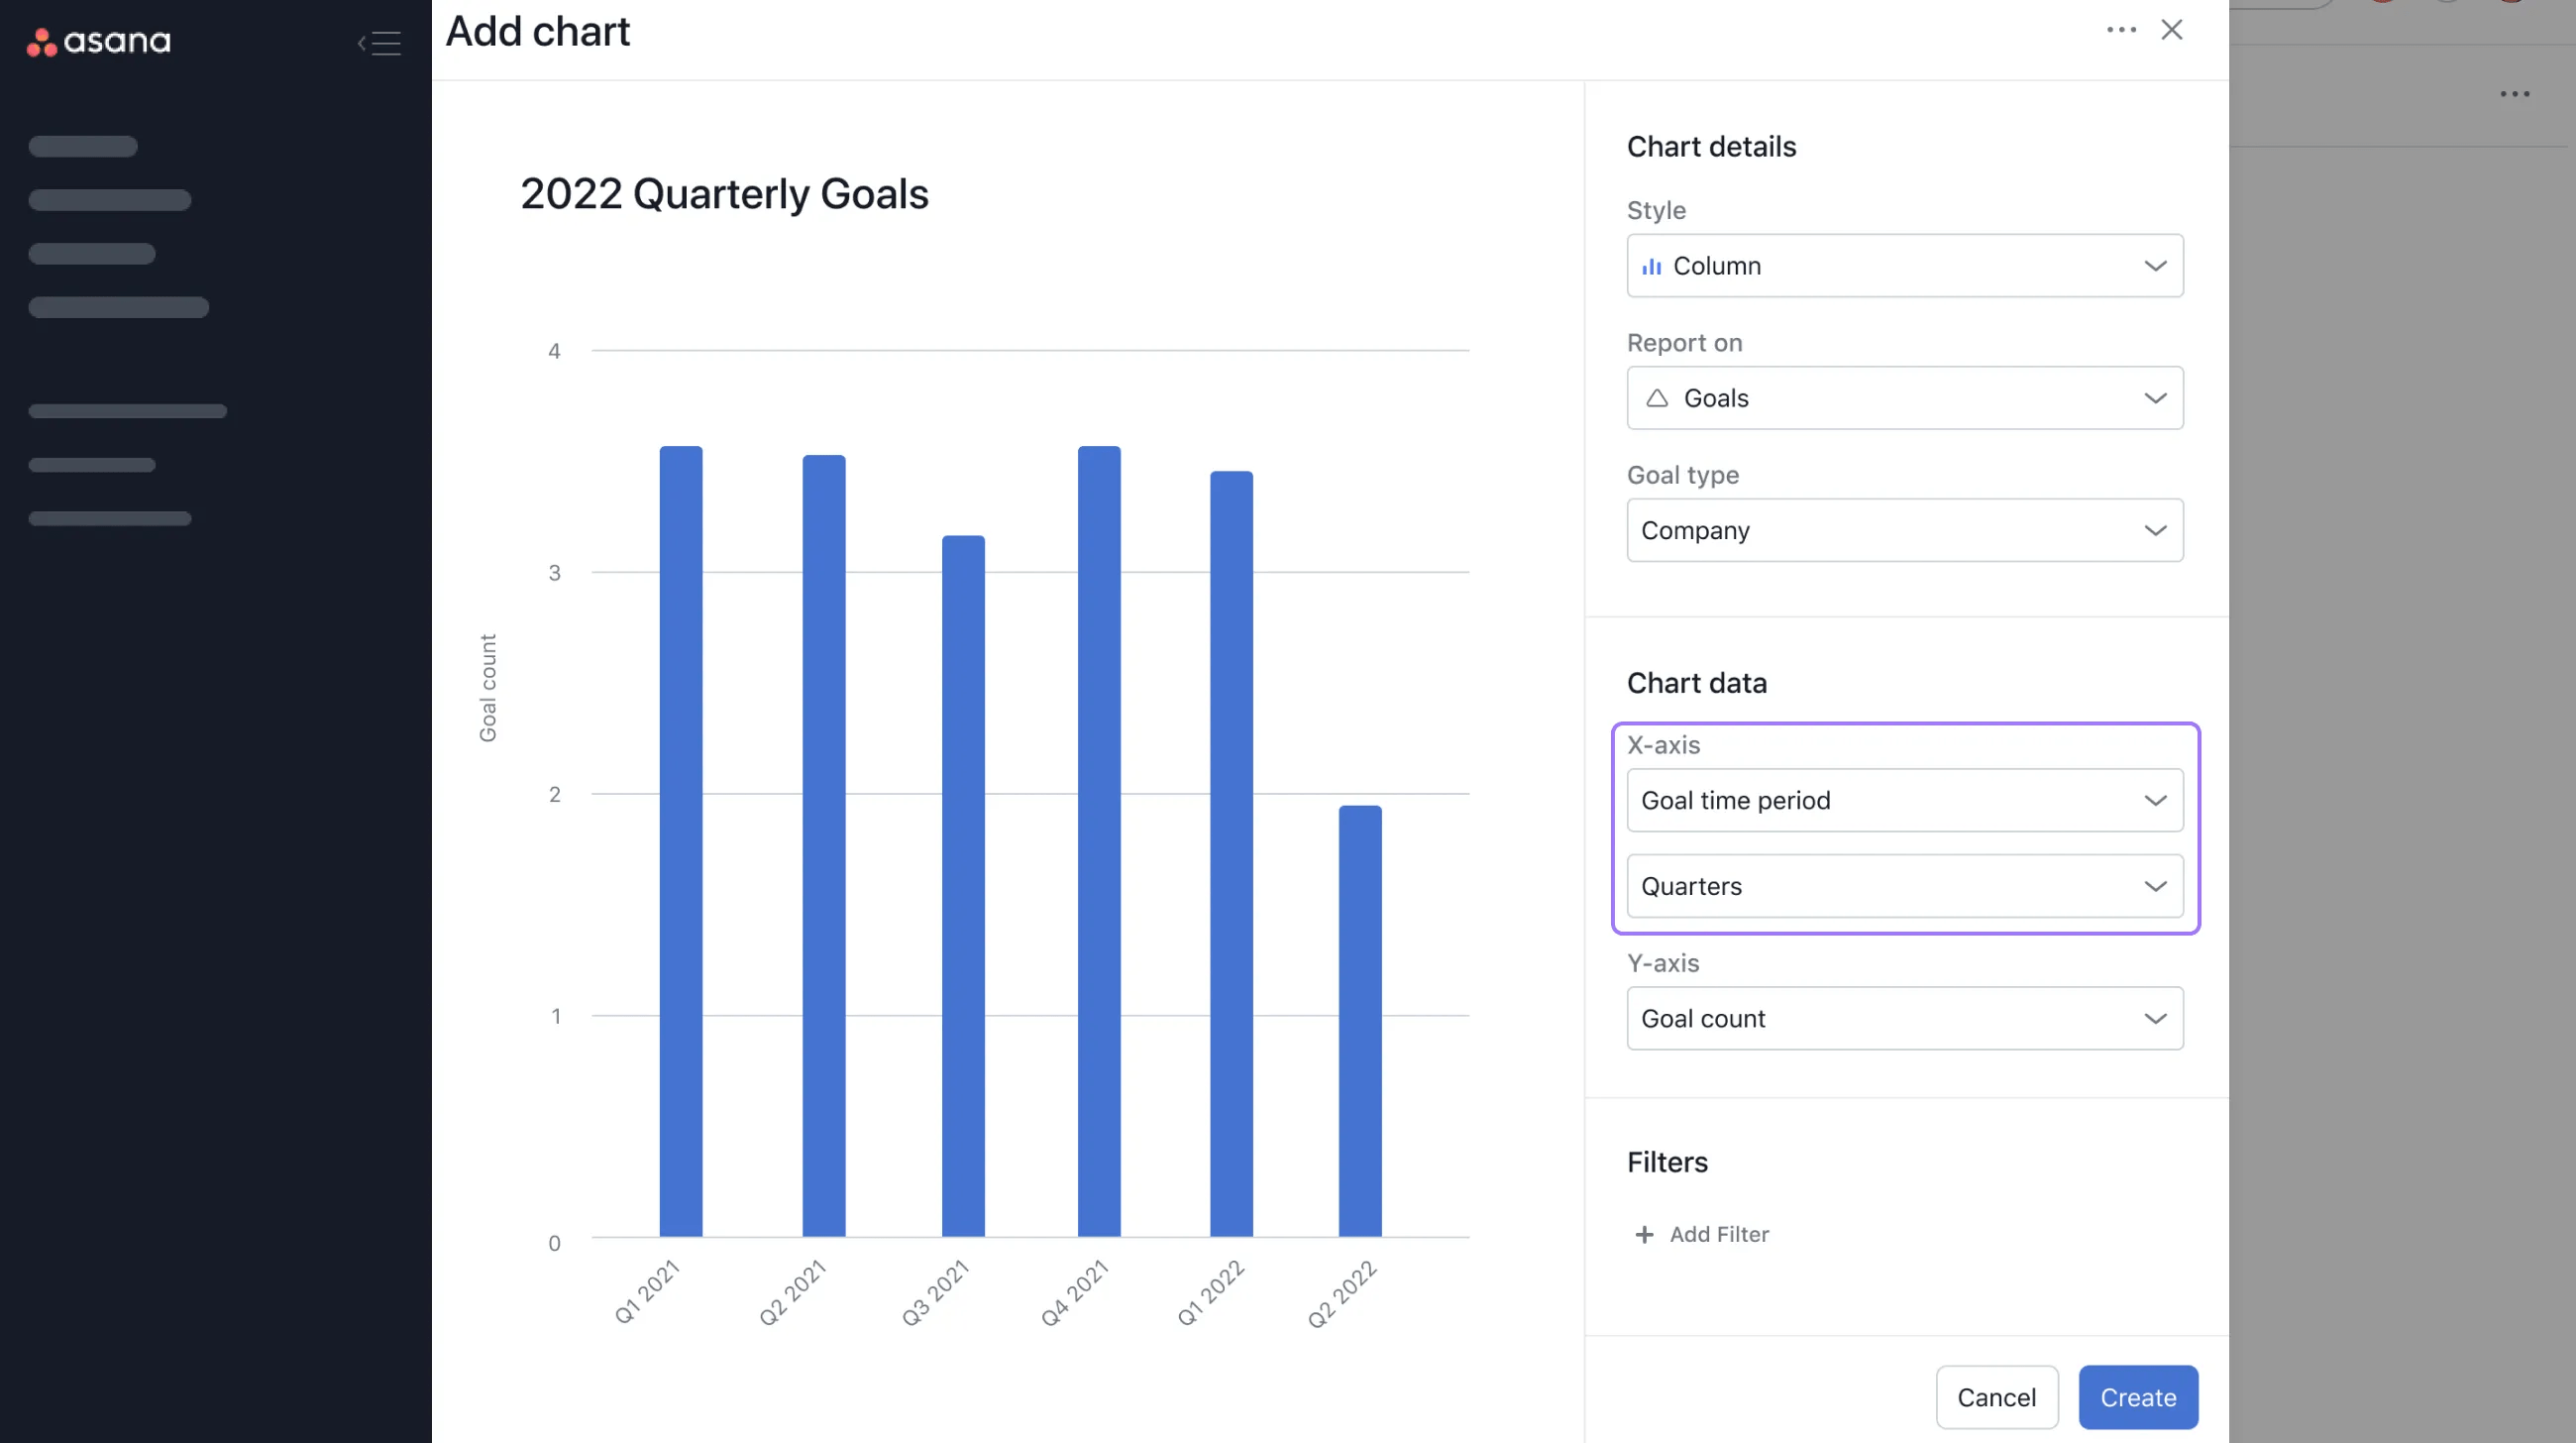
For the X-axis, you can choose between:
If you select Goal time period, you can view per quarters, halves, years, and all.
You can also use filters to customize your charts. You can filter by:
Get an accurate picture of what's happening in your team with universal reporting. Get started with a free Asana trial. Try for free
Within universal reporting, you can create charts based on portfolio metadata, meaning you can report on portfolios, tasks, projects, and goals.
Available on Asana Advanced, Enterprise, and Enterprise+ tiers, as well as legacy tiers Business and Legacy Enterprise.
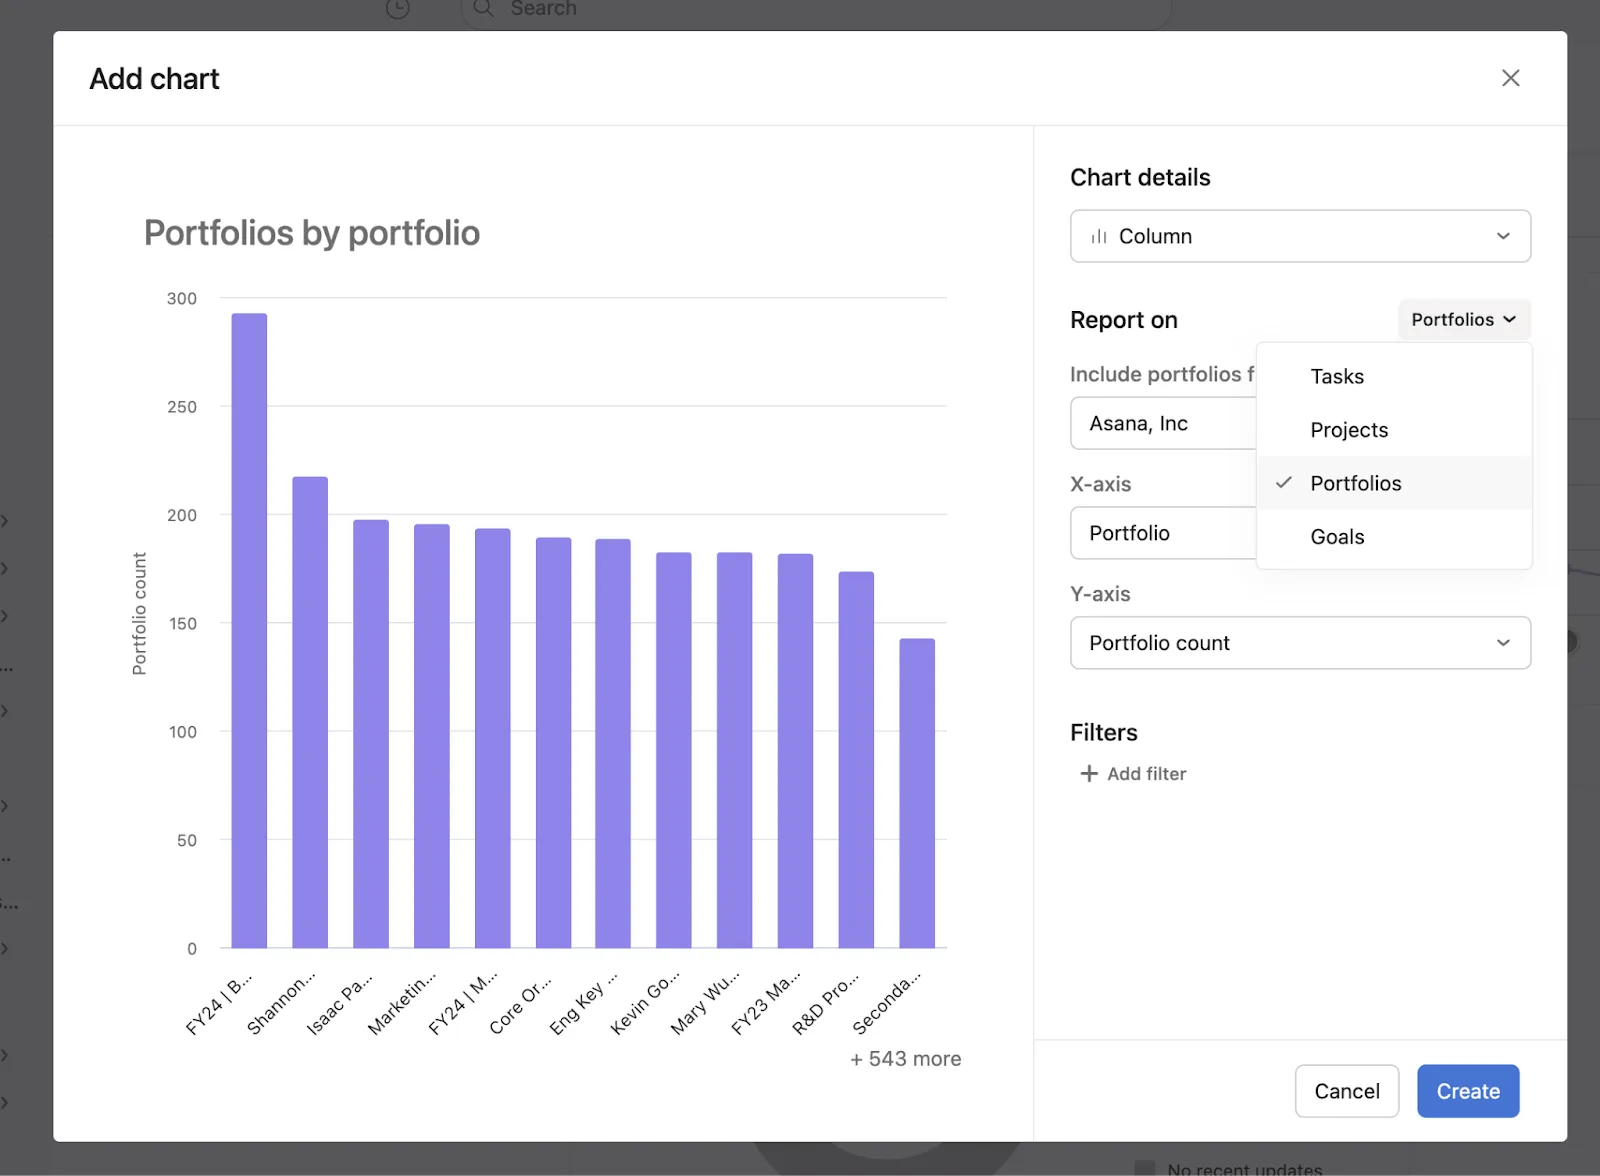
When creating a portfolio chart, you need to pick where portfolios should be included and can choose from the following options:
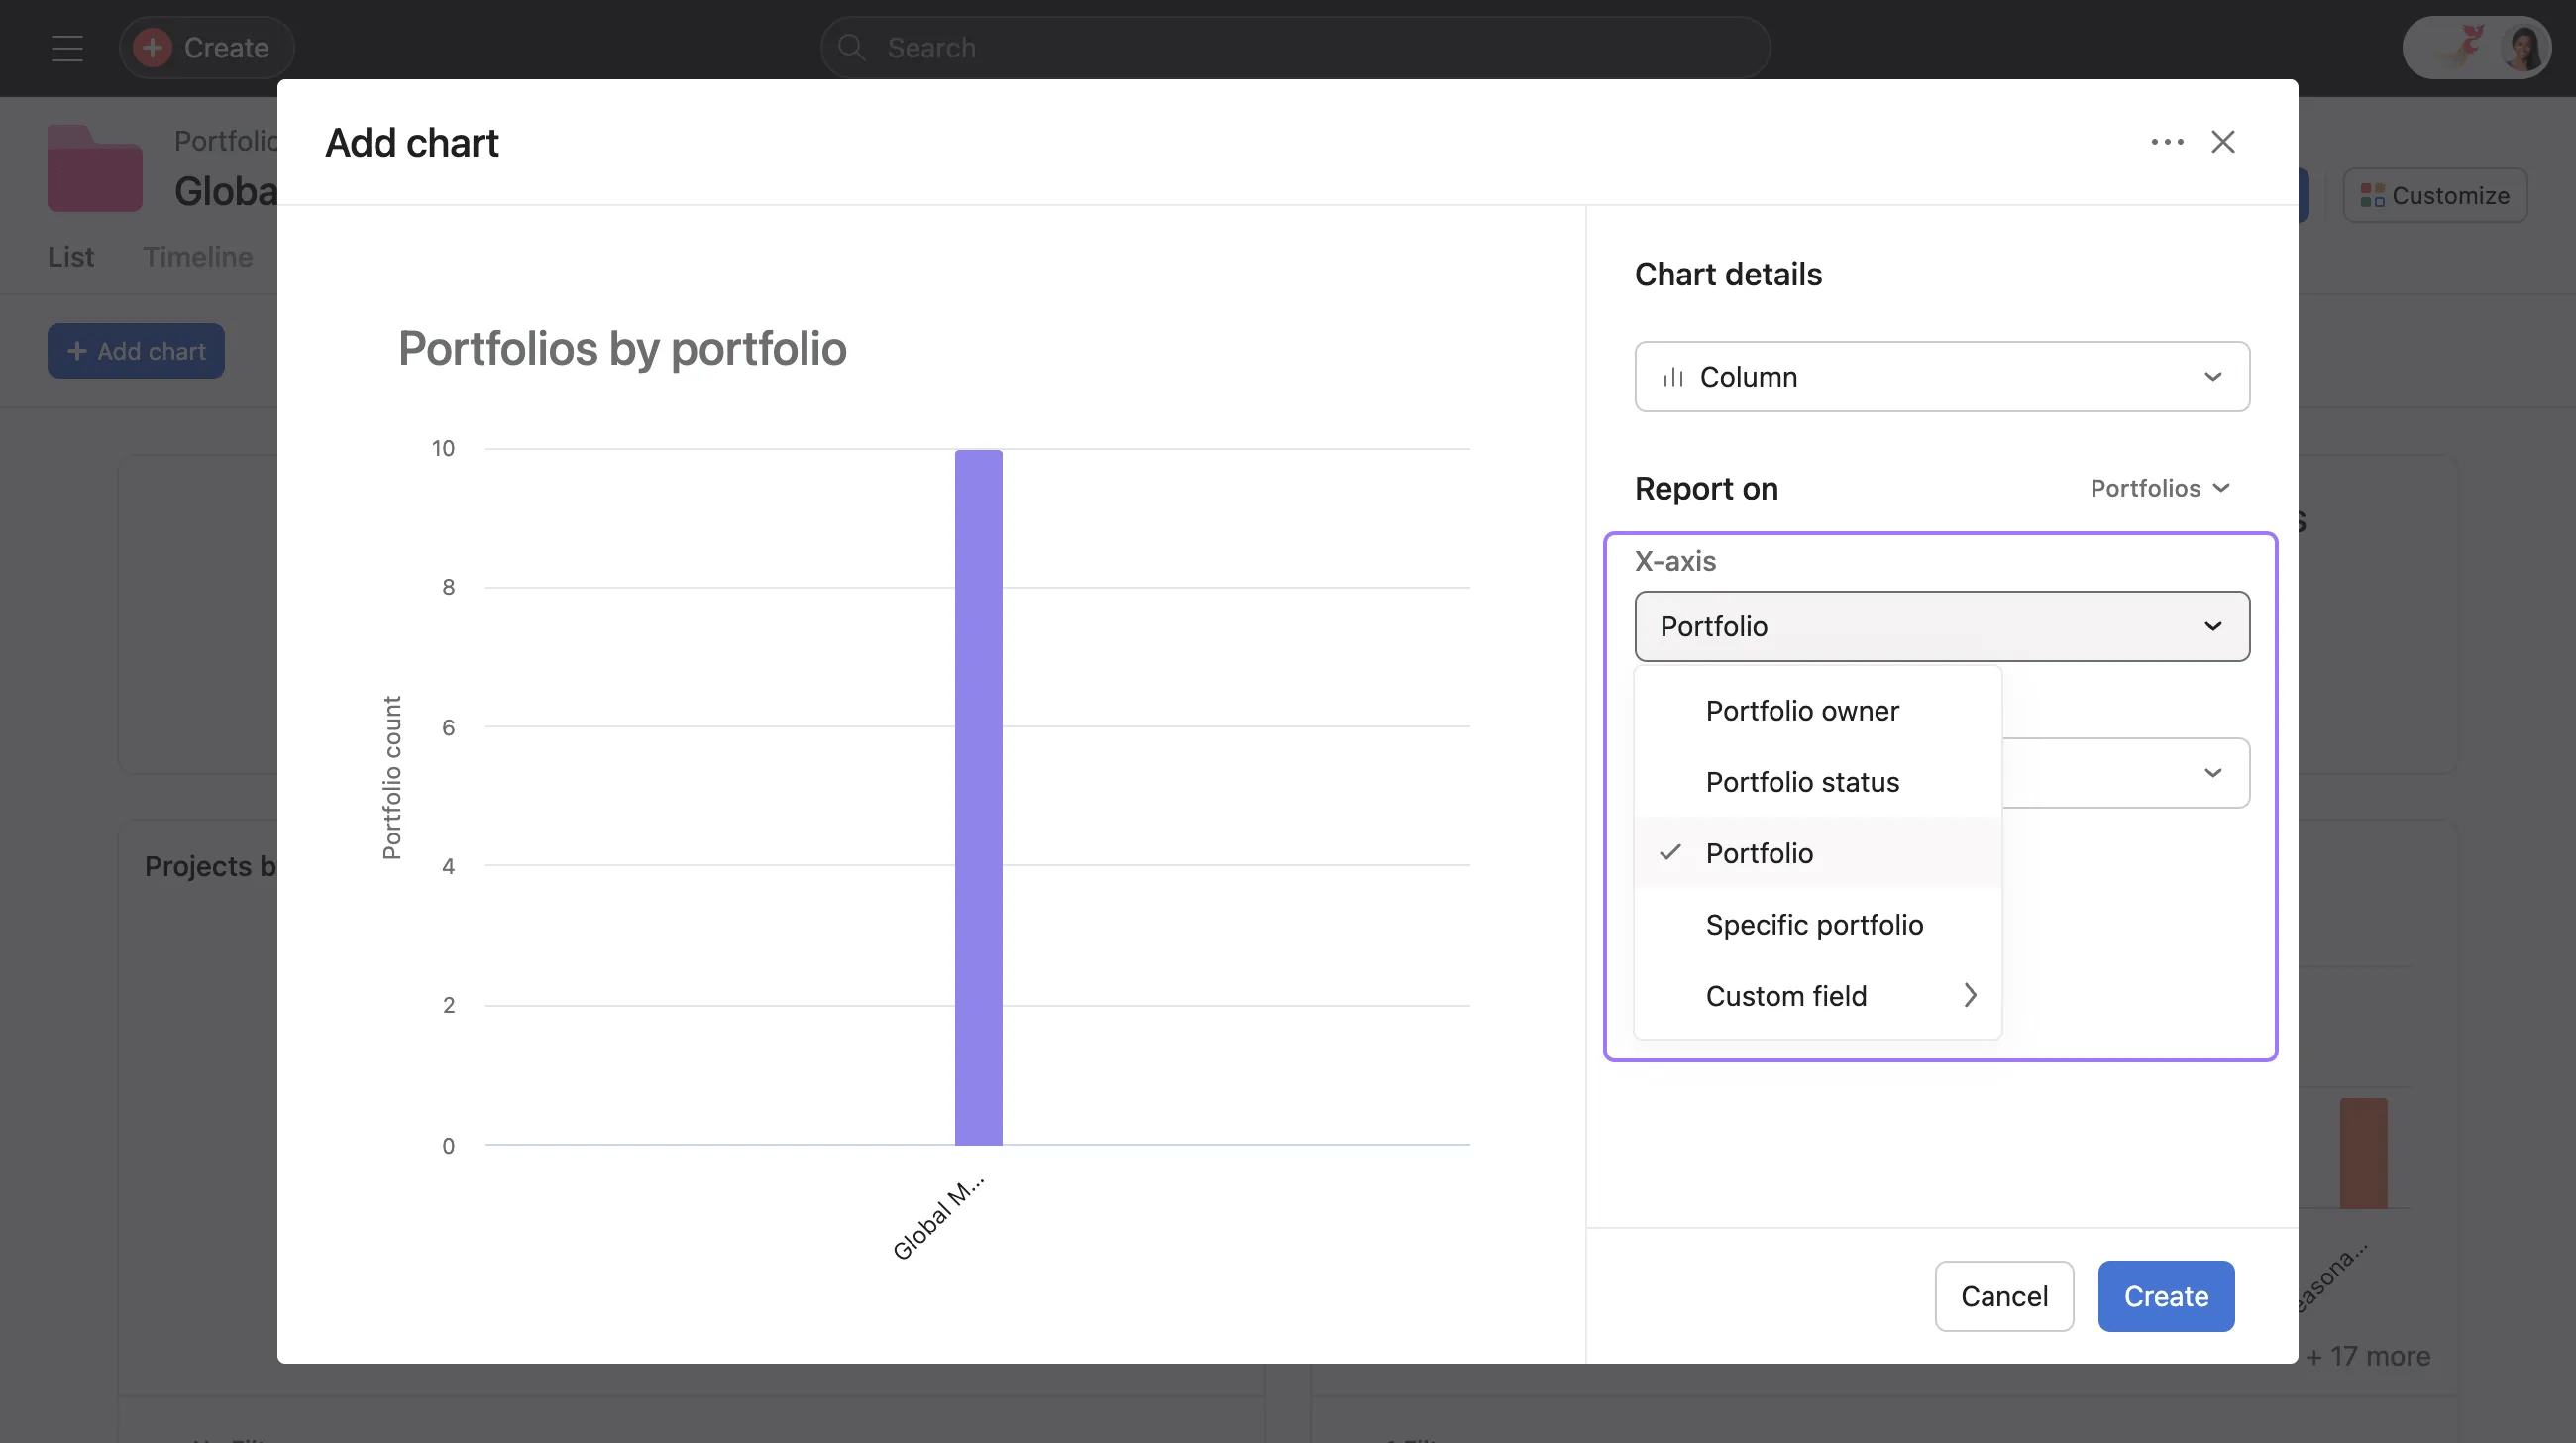
You can customize the X-Axis groupings by:
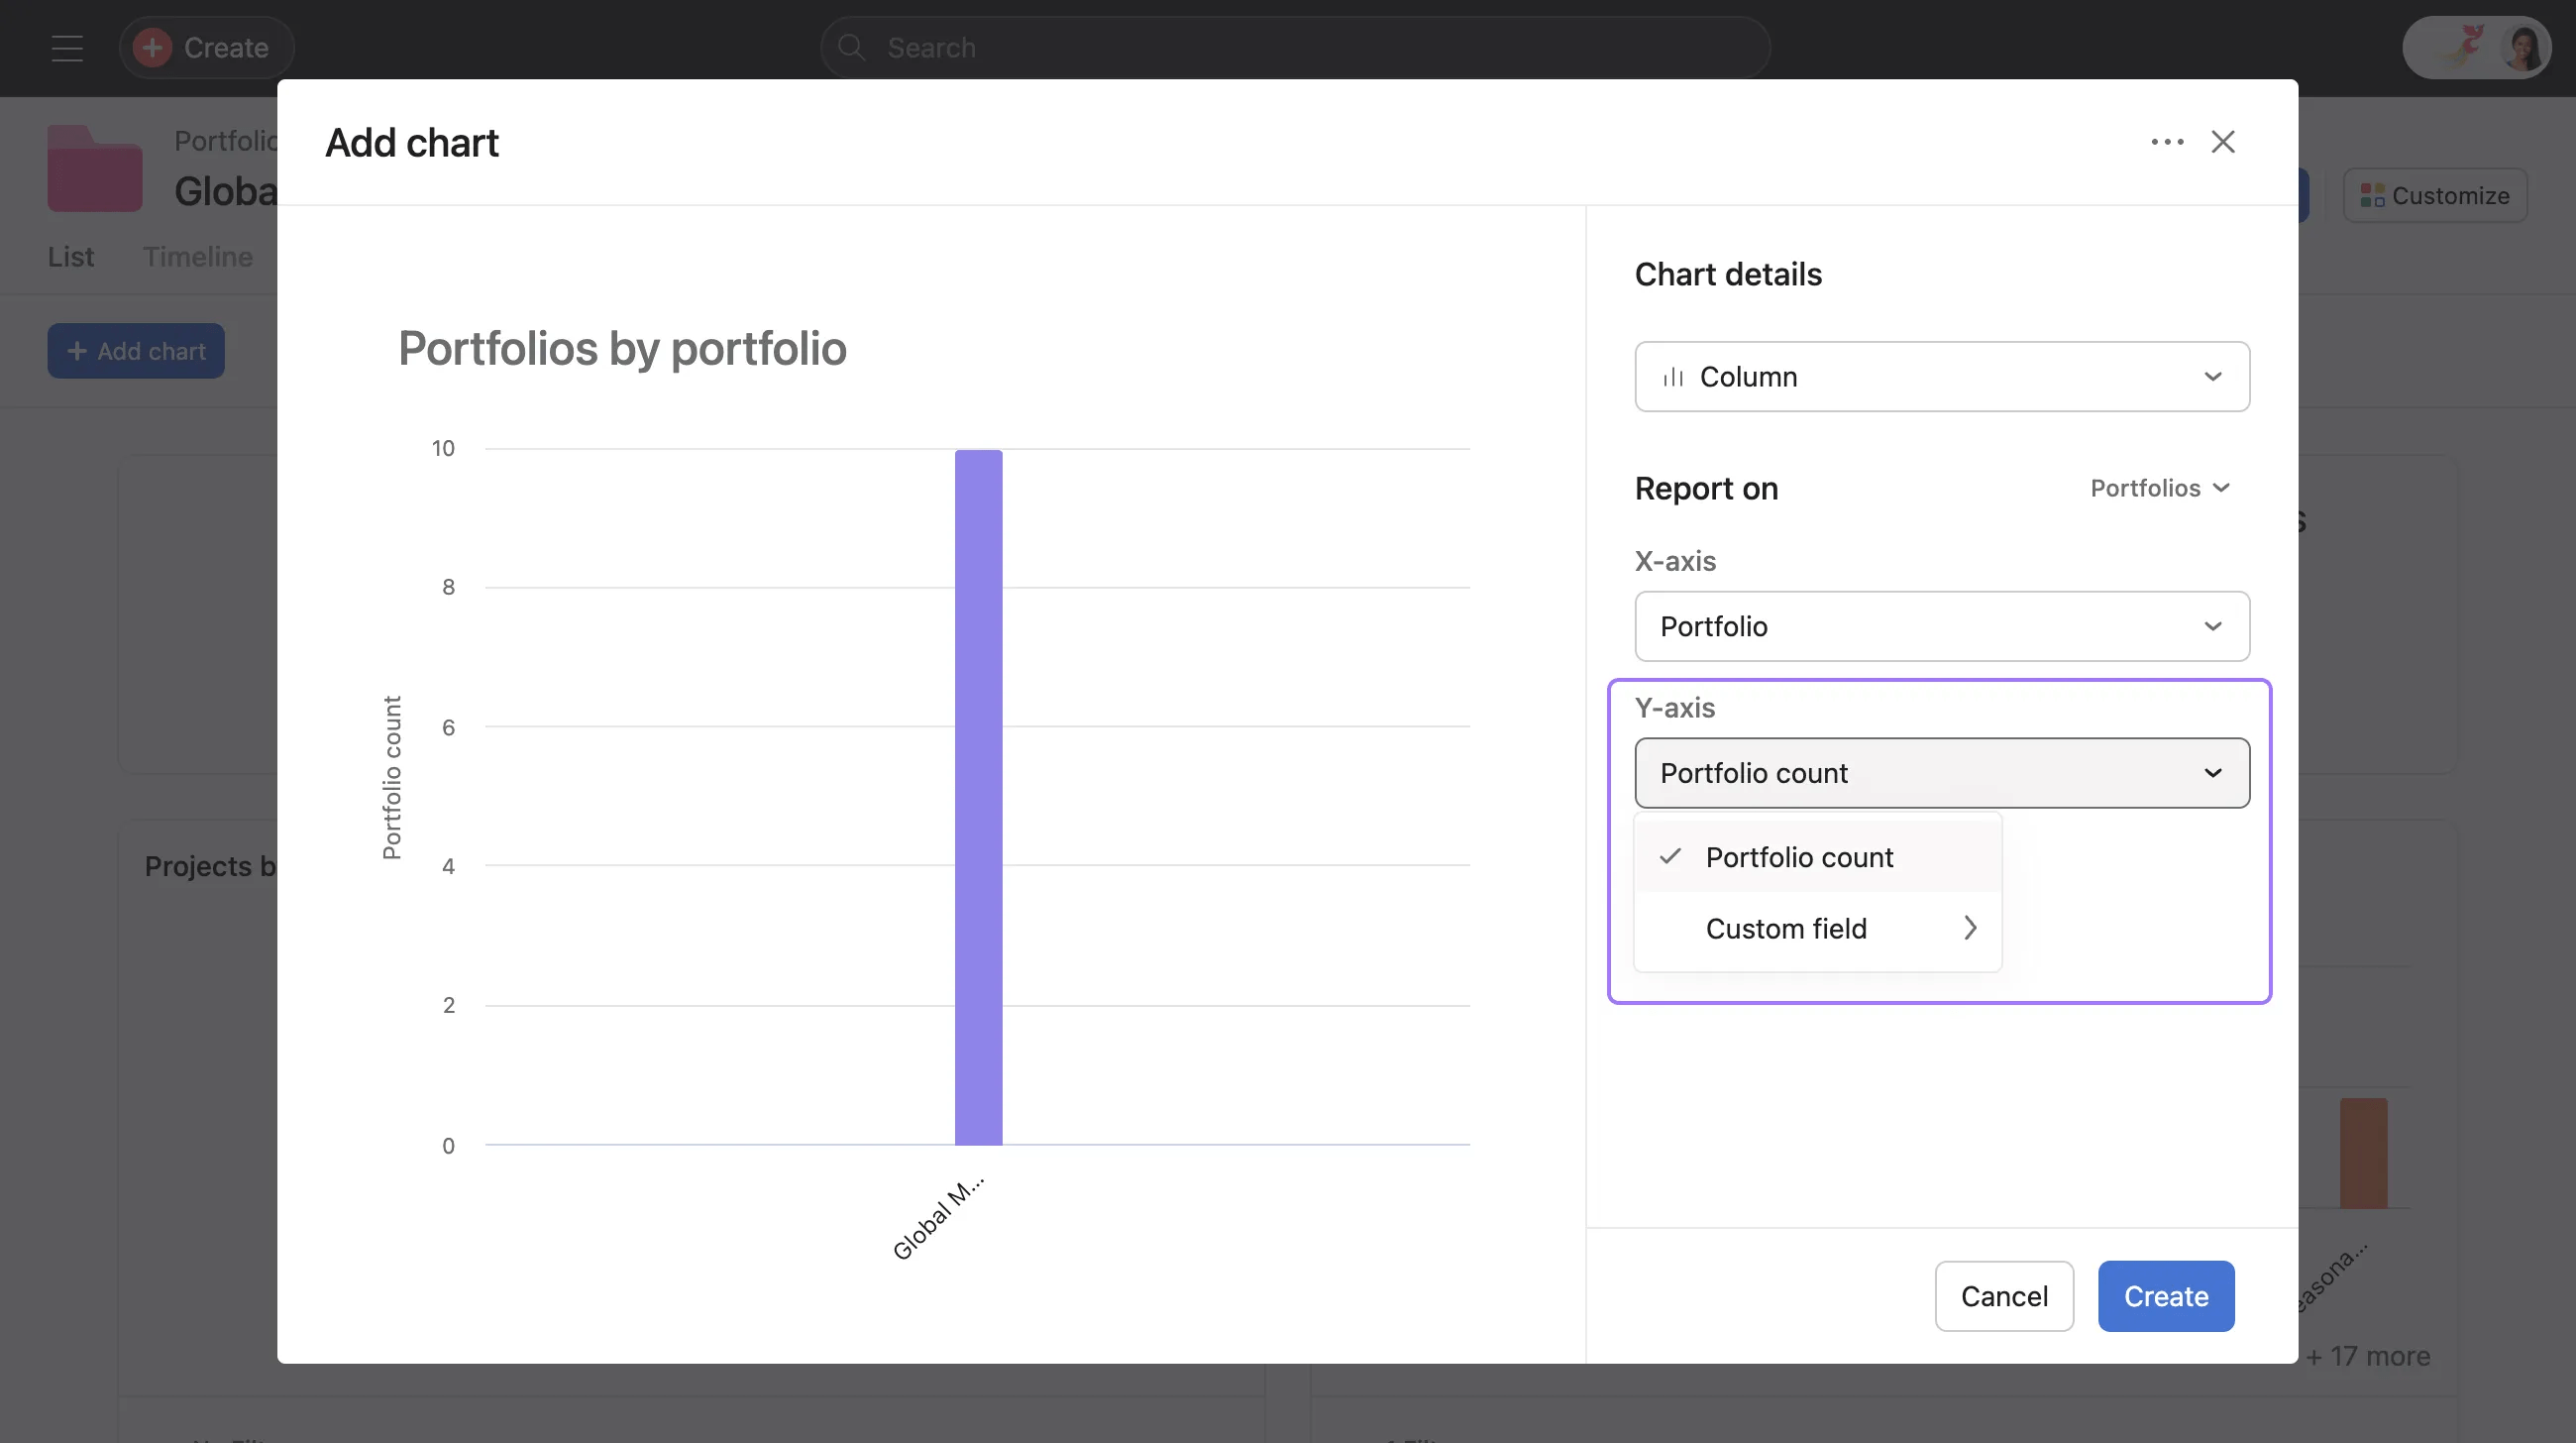
You can customize the Y-Axis groupings by:
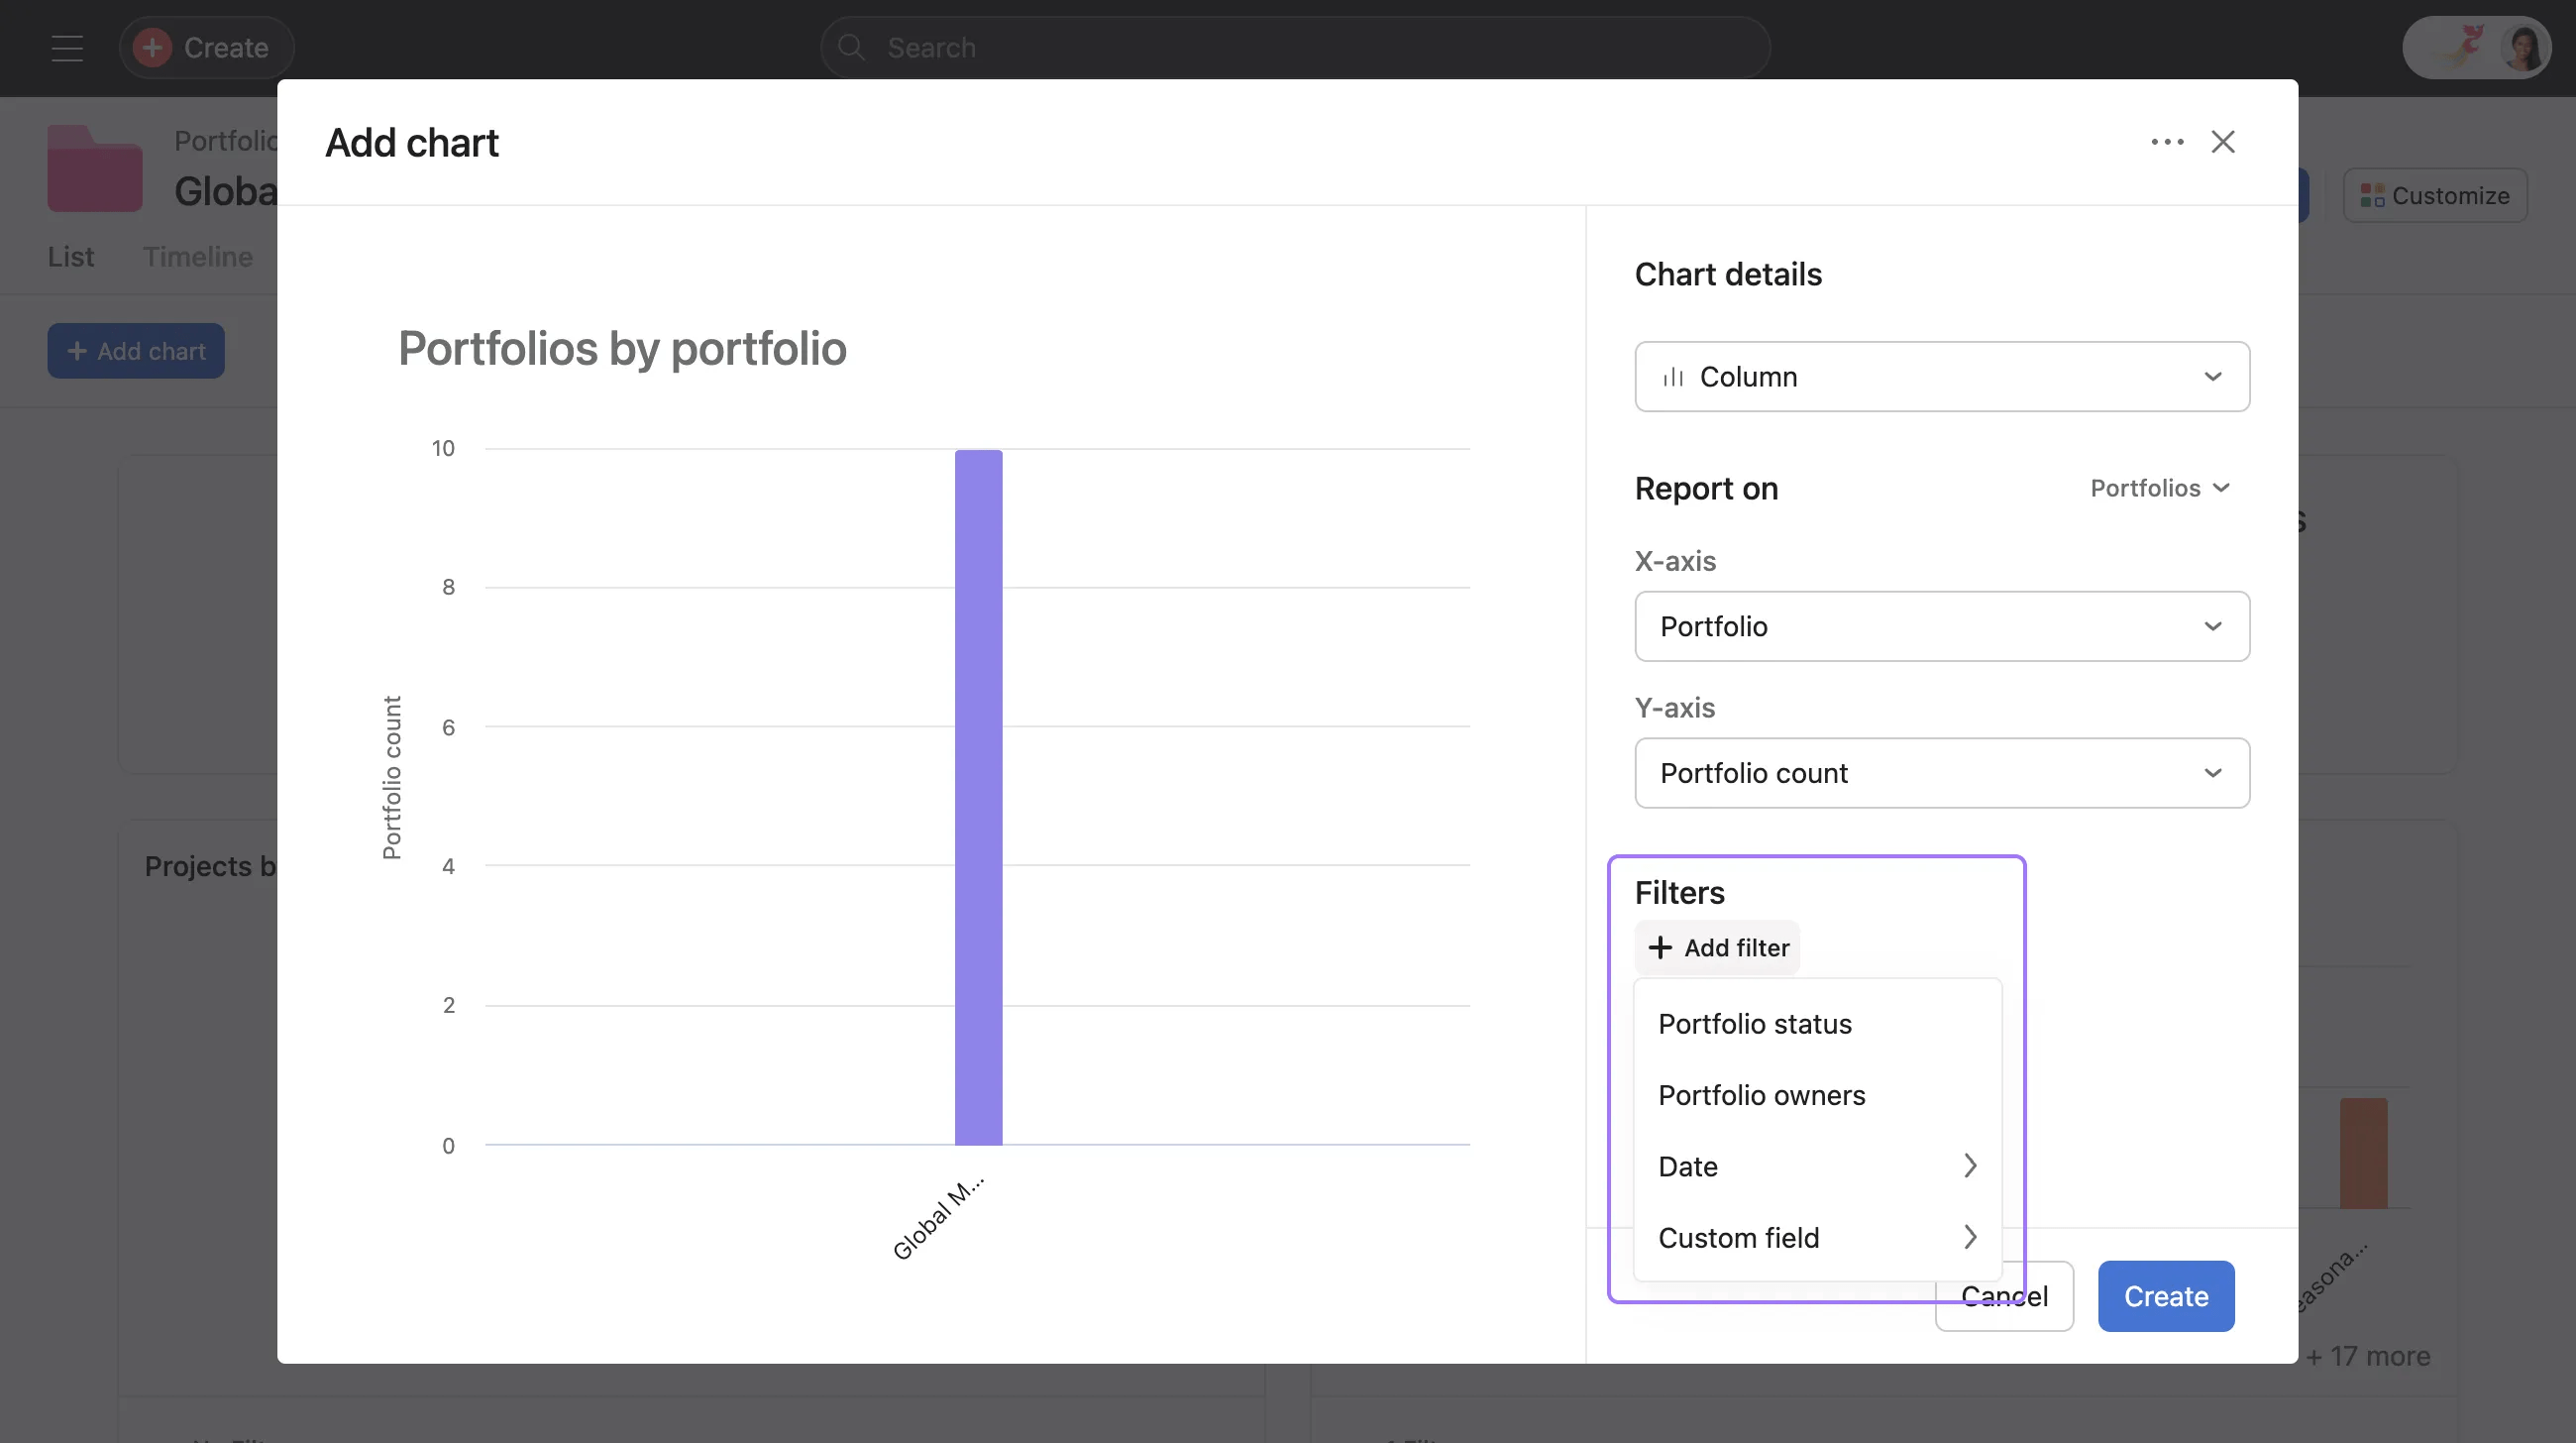
You can filter by:
By default, all dashboards are private to the owner of the dashboard.
When collaborators view a shared dashboard, they have Read Only access. Charts will appear the same to anyone who views the dashboards and reflect the permissions of the dashboard creator.
When clicking into a chart segment, collaborators will only see the underlying data that they have access to.
Admins can turn off universal reporting at the domain level in the admin console. If universal reporting is turned off, users will not see the Reporting tab.
If you do not see the Reporting tab and think this is a mistake, contact your admin to talk about enabling it.