ASANA AI
Ämnen
- Ny navigering i Asana
- Skapa uppgifter i Asana
- Skapa projekt i Asana
- Kom igång med Asanas mobilapp
- Upptäck populära funktioner
- Snabbstartsguide till Asana
- Alla Asana-funktioner
- Du har blivit inbjuden till Asana; vad händer nu?
- Skapa din perfekta arbetsyta
- Olika typer av uppgifter
- Använda Asanas hjälpresurser
- Använda Asana
- Samarbeta i Asana
- Hur Asana fungerar
- Asanas skrivbordsapp
- Ställ in vidarebefordran av e-post.
- Ställa in din Asana-profil
- Förstå sekretess och synlighet i Asana
- Ställ in appar
- Kontoinställningar
- Hacks
- Inställningar
- Tillgänglighet
- Aviseringsinställningar
- Asana-översikt för skärmläsaranvändare
- Flera frånvarouppgifter
- Profilinställningar
- Visningsinställningar
- Kortkommandon
- Hitta arbete snabbt med sökning
- Hantera och prioritera dina uppgifter
- Automatisera och skala upp ditt arbete med menyn Anpassa
- Skapa projekt snabbt med mallar
- Tilldela uppgifter till teamkollegor
- Håll dig informerad med din Asana-inkorg
- Strukturera dina projekt tydligt
- Kraftfulla Asana-funktioner för arbetsledning
- Kommentarer, meddelanden och statusuppdateringar
- Öka produktiviteten med Mina uppgifter
- Anpassa dina projekt och portfolior
- Planera och genomför projekt med en deadline.
- Sätt upp och spåra förlopp mot mål
- Så här väljer du rätt projektutkast för ditt arbete
- Använd Asana för teamledare
- Rapportera med paneler
- Bjuda in teammedlemmar till Asana
- Anslut dina verktyg till Asana
- Övervaka initiativ och spåra arbetet med portfolior och dashboards
- Rapportering med arbetsbelastning
- De mest populära Asana-integreringarna
- Planering med Asana-kalendern
- Spåra projektförloppet.
- Dela projektuppdateringar
- Så avbryter du din Asana-provperiod
- Min provperiod har tagit slut, vad händer med mina uppgifter, regler och arbetsflöden?
- Få ut mesta möjliga av din Asana-provperiod
- Registrera dig för en kostnadsfri Asana-provperiod
- Köp ett abonnemang efter en provperiod
- Sätt upp mål under din provperiod med Asana
- Bjud in andra under din provperiod
- Förvandla din provperiod till ett betalt abonnemang
- Tilldela arbete automatiskt med anpassade fält
- Bygg grunden för ditt arbetsflöde
- Automatisera hur arbetet rör sig genom olika faser
- Sätta arbetsflödet i rörelse
- Vad är ett arbetsflöde?
- Multi-homing för att undvika informationssilor
- Kontrollera hur uppgifter läggs till i projekt
- Begär en uppgiftsgranskning med en enkel automatisering
- Använd beroenden för att starta arbetet vid rätt tidpunkt.
- Tilldela arbete baserat på prioritet
- Flytta dina vanliga arbetsflöden till Asana
- Skapa tvärfunktionella arbetsflöden i Asana
- Regelintegreringar och widgetar
- HubSpot-regelintegrering
- Regelintegreringar för produktivitet och kommunikation
- Regelintegrering med PagerDuty
- Regelintegreringar för molnlagring och fildelning
- Villkor och förgrening i regler
- Arbetsflödesverktyget
- Anpassa formulär
- Filtrering och sortering av anpassade fält
- E-postkommunikation med personer som har skickat in formulär
- Typer av beroenden
- Dela ett formulär
- Använd regelåtgärder
- Tillämpa samlingar på projekt
- Bevilja behörigheter för regler
- Anpassade formelfält
- Anpassade fält
- Utlös manuella regler.
- Använd anpassade ID-fält.
- Fältmappning i FORMS
- Använd hanteringspanelen för projektmallar.
- Pakethantering och behörigheter
- Samlingar vanliga frågor och svar
- Använd regelutlösare
- Visa regelhistorik
- Hanteringspanel för globala fält
- Automatisk anpassning av datum för beroende uppgifter
- Variabler i regler
- Mallar för statusuppdateringar
- Tidsuppföljning i Asana
- Uppgiftsberoenden
- Godkännanden
- Formulär
- Projektmallar
- Mallar för uppgifter
- Samlingar
- Regler
- Ställa in datum i regler
- Anpassade referensfält
- Typer av anpassade fält och begränsningar
- Migrera tidsspårningsdata från Everhour till Asana
- Asana och arbetsplats från Meta
- Asana för Adobe Creative Cloud
- Vimeo och Asana
- Jira Data Center – vanliga frågor och svar
- Jira Data Center
- Efterlevnadshantering: API- och integreringssupport
- Instagantt och Asana
- Använd Googles smarta chip
- Google Kalender + Asana
- Kalendrar och Asana
- GitHub och Asana-integrering
- Google Formulär och Asana
- Google och Asana
- Google Kalkylark och Asana
- Integrera Power BI
- Zoom-möten i Asana
- Asana för Gmail-tillägg
- Microsoft Teams och Asana-integrering
- Använd Zapier och Asana
- Wufoo och Asana
- Använd Tray.io och Asana.
- Skapa ett arbetsflöde för Zoom-samtalsanteckningar med Asana Studio
- Zoom-transkriptioner för automatisering och Asana Studio
- Asana för Jira Cloud – vanliga frågor och svar
- Chrome-tillägg och Asana
- Zendesk-integrering
- Webbformulär och Asana
- Outlook-kalender och Asana
- Splunk + Asana
- Asana i Salesforce AppExchange (fasas ut)
- Asana-appen i ChatGPT
- ServiceNow och Asana
- Aktivera behörigheter för Asana-skapade integreringar och Microsoft 365-integreringar
- Asana för Tableau-integreringen
- Asana för Jira Cloud
- API
- Asana för Outlook-tillägg
- Asana-appen i Claude
- Slack och Asana
- Salesforce-integrering i Asana
- Kom igång med Asana-mål
- Måltyper och mallar
- Förlopp, status och koppling av arbete till mål
- Kartor över målstrategier
- Skriv bra mål med Asana-mål
- Vanliga frågor om Asana-mål
- Visa och filtrera dina mål
- Viktade mål
- Målspårningsprocessen med Asana-mål
- Led målhanteringsprocessen i din organisation med Asana-mål
- Skydda och dela mål
- Kvalitetskontroll
- Anpassade uppgiftstyper och statusar
- Fält för uppgift
- Regler i Mina uppgifter
- Spara tid i Asana.
- Textformatering i Asana
- Schemaläggning av uppgifter med startdatum, slutdatum och tider
- Mina uppgifter
- Uppgiftsåtgärder
- Omvandla uppgifter till projekt
- Anpassade fält i Mina uppgifter
- Vyer i Mina uppgifter
- Förstå uppgifter
- Kommentarer till uppgifter och bilagor
- Underuppgifter
- Taggar
- Skicka uppgifter till Asana med e-post
- Delbara anteckningar i Asana
- Projektägare och projektmedlemmar
- Kalendervy
- Listvy
- Visa kritiska linjen på tidslinjen.
- Visa filvy
- Avsnitt
- Tidslinje
- Förstå projekt
- Importera data från andra verktyg till projekt i Asana
- Gantt-vy
- Fliken projektöversikt
- Hantera uppgifter och beroenden med tidslinjen
- Gantt-vy FAQ
- Tavelvy
- Avancerade alternativ för CSV-import
- Projektvy för inbäddade medier
- Import och export av projekt
- Förbereda data för CSV-import
- Projekt utan team
- Anteckningsvy
- Projektanpassning och projektvyer
- Individuella projektbehörigheter
- Översikt över behörigheter
- Redigera begränsning för anpassade fältvärden
- Använd privata anpassat fält
- Projektbehörigheter
- Skrivskyddade länkar
- Sekretessinställningar för projekt
- Dela med team
- Åtkomstnivåer för anpassat fält
- Asana-behörigheter för anpassade fält
- Granskarens projektåtkomstnivå
- Adminåtkomstnivå för projekt
- Domänomfattande adminkontroller
- Behörigheter för teaminnehåll för teamadministratörer
- Åtkomstnivån redigerare
- Behörigheter för team
- Dela och begränsa åtkomst till team
- Uppgiftsbehörigheter
- Åtkomstbehörigheter för formulär
- Arbetsbelastning
- Projektförlopp och statusuppdateringar
- Logga och lämna in tidrapporter
- Hantera tidrapportsgranskare och godkännanden
- Spåra projektbudgetar och projektförloppet med tillägget Tidrapporter och budgetar
- Rapportering med tillägget Tidrapporter och budgetar
- Konfigurera tillägget Tidrapporter och budgetar
- Kapacitetsplanering
- Asana för agila team och Scrumteam
- Använd en RACI-matris i Asana
- Stäng processer i slutet av månaden för finansiella team.
- Skapa idéer och brainstorma
- Använd pipelines
- Asana för teammöten
- Ge feedback och godkännanden.
- Projektintagning
- Planera och hantera företagsmål
- Planera resurser
- Strategisk planering för organisationer
- Använda Asana för projekthantering
- En-mot-en
- Använda Asana för att spåra kundfeedback
- Använd Asana för kontospårning
- Använd Asana för försäljnings- och kontohanteringsteam.
- Lanseringsöversikt
- Skapa en kalender för videoproduktion
- Hantera designfeedback och granskningsmöten
- Skapa kreativ produktion
- Kampanjhantering
- Skapa en innehållskalender i Asana
- Evenemangsplanering med Asana
- Strategisk planering för marknadsföring
- Kreditoptimering för Asana Studio
- Skapa arbetsflöden med ord i Asana Studio
- Asana Studio Plus
- Arbeta smartare med Asana AI
- Anslut ditt smarta arbetsflöde till rätt datakällor.
- Vanliga frågor om Asana Studio
- Skrivinstruktioner i AI Studio
- En administratörsguide till Asana Studio
- Så här skapar du en prompt i Asana Studio
- Felsökning i Asana Studio
- Asana Studio – Human in the loop
- Förbyggda AI-regler i Asana Studio
- Skapa smarta arbetsflöden med Asana Studio
- Så här fungerar variabeln Använd AI
- Introduktion till Asana AI Studio
- Asana Studio-modeller
- Asana Studio-tillägg och prissättning
- Åtkomst och behörigheter
- Ställa in Asana-roller i Okta med SCIM
- Så här separerar du Asana-konton
- Rollbaserad åtkomstkontroll (RBAC) med anpassade roller
- Asana EU-datacenter
- Enterprise-nyckelhantering
- Obligatorisk tvåfaktorsautentisering
- eDiscovery resurscenter
- Servicekonton
- HIPAA-efterlevnad
- Tvåfaktorsautentisering
- Sekretess och säkerhet
- Konton
- Kartlägg SAML-grupp och interagera med SCIM.
- Hantera lösenordsinställningar i adminkonsolen
- Asana och efterlevnad av globala handelsregler
- Ställ in SAML-gruppmappning för licenser
- Flera konton och sammanfogning
- Ta bort ditt Asana-konto
- E-postpolicy för Asana-konto
- Tillägg för behörighetshantering
- Efterlev FedRAMP
- Tillägg för efterlevnadshantering
- Säkerhetsbehörigheter för mobilappar
- Automatiskt borttagning av gäster
- Globala autentiseringsinställningar
- provisionering och avprovisionering av användare med hjälp av SCIM
- Gör anspråk på administratörsbehörigheter för arbetsobjekt
- Kontroller för redigering av profilfält
- SecureAuth för Enterprise-organisationer
- Apphantering och integreringar
- Asanas datacenter i Japan
- Säkerhetskontroller för administratörer
- Asana IP-adressintervall och värdnamn
- Datalagring för Asana
- Implementering med flera organisationer
- Konfigurera Asana-roller i Microsoft Entra ID med SCIM
- Så här får du åtkomst till adminkonsolen
- Rollerna administratör och superadministratör i Asana
- Policy för datalagring
- Alternativ för autentisering och åtkomsthantering för betalabonnemang
- Lista över godkända IP-adresser i Asana
- Hantera personer i organisationer
- Tilldela licenser i avdelningar
- Hantera medlemmar och team i en avdelning
- Hantera team via adminkonsolen
- Universitetsorganisationer
- Hantera en organisation
- Läs om avdelningar i Asana
- Avdelningsåtkomst och hantering FAQ
- Avancerad divisionshantering
- Asana-sandlådor
- Vanliga frågor om arbetsytor och organisationer
- Hantera arbetsytor
- Förstå arbetsytor
- Hantera medlemmar i en organisation
- Bli medlem och samarbeta i arbetsytor
- Hantera godkända arbetsytor
- Ditt Asana-konto
- Presentation av Asana Gov
- Hantera organisationsinställningar
- Avdelningar i betalande organisationer
- Säkerhet och fakturering för avdelningar
- GST i Singapore
- Moms i Sydafrika
- Moms i Sydkorea
- Moms i Schweiz
- USA: s omsättningsskatt
- Moms i Storbritannien
- Uppgradera eller ändra ditt Asana abonnemang
- Lägga till betalningsmetoder för manuellt fakturerade kunder
- Australien GST
- Ändringar för automatiska betalningar i Indien på grund av den indiska centralbankens nya föreskrifter
- EU VAT
- Moms i Island
- Moms i Indonesien
- GST i Nya Zeeland
- Moms i Norge
- Betalningar i valutorna MXN och BRL
- Betalningar i valutorna CAD och KRW
- Åtkomst till din faktureringssida
- Moms och försäljningsskatt
- Betalningsmetoder och fakturor
- Faktureringsinställningar i adminkonsolen
- Hantering och uppgraderingar av abonnemang
- Filippinsk moms
- GST/HST, QST och provinsiell moms i Kanada
- Avsluta ditt Asana-abonnemang
- Fakturering
- Lär dig mer om Asana Legacy Enterprise funktioner
- Lär dig mer om Asana Premium-funktioner
- Lär dig mer om Asana Business-funktionerna.
- Hantera ditt växande Asana-abonnemang
- Avdelningar
- Lär dig mer om Asana för avancerade användare.
- Läs mer om Asana Starter-funktioner
- Information om Asana Personal-abonnemanget
- Asana för ideella organisationer
- Asana-abonnemang och prissättning
- Prissättning och köp
- Ändra ditt Asana-abonnemang
- Läsåtkomst
- Integreringar tas bort
- Felsökning av webbläsar- och anslutningsproblem
- Ta bort av misstag
- Säkerhet och behörigheter
- Skapa uppgifter och underuppgifter
- Grunderna i Asana-forumet
- Avsluta personliga projektutrymmen
- Vanliga frågor om avskaffande av Salesforce AppExchange-integrering
- Vanliga frågor om Asana-certifiering
- Navigering och visning
- Hur får jag support från Asana?
- Återställ borttagna uppgifter, projekt och mycket mer
- Vanliga frågor om uppdatering av automatiseringsbehörighet
Google Kalkylark och Asana
Tillgängligt med abonnemangen Asana Starter, Advanced, Enterprise och Enterprise+ samt med de äldre abonnemangen Business och Legacy Enterprise.
Gå till vår prissättningssida för mer information.
Med rapportering i Google Kalkylark kan du använda projektdata för att skapa anpassade rapporter och visualiseringar för att se vad som är i fas och vad som behöver kontrolleras. Googles arkexport är tillgänglig för portfolior, projekt och avancerade sökresultat. Den här artikeln hjälper dig att komma igång och ger inspiration för att skapa rapporter.
Använda rapportering i Google Kalkylark
Se till att du har lagt till lämpliga projekt innan du öppnar ett Google Kalkylark i din portfolio. Vi rekommenderar att du konsulterar Googles hjälpcenter och hjälpforum för Google Kalkylark om du är nybörjare på Google Kalkylark.
Komma igång
- Installera Asana Exports-tillägget i Google Drive via den här länken.
- Kopiera din Asana-exportlänk för att synkronisera med Google Kalkylark.
-
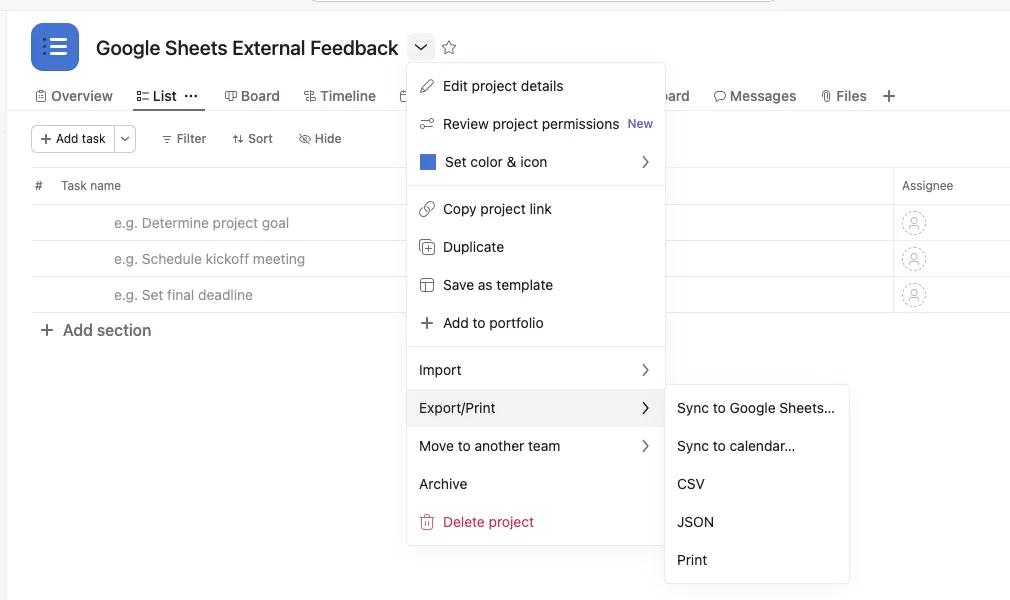
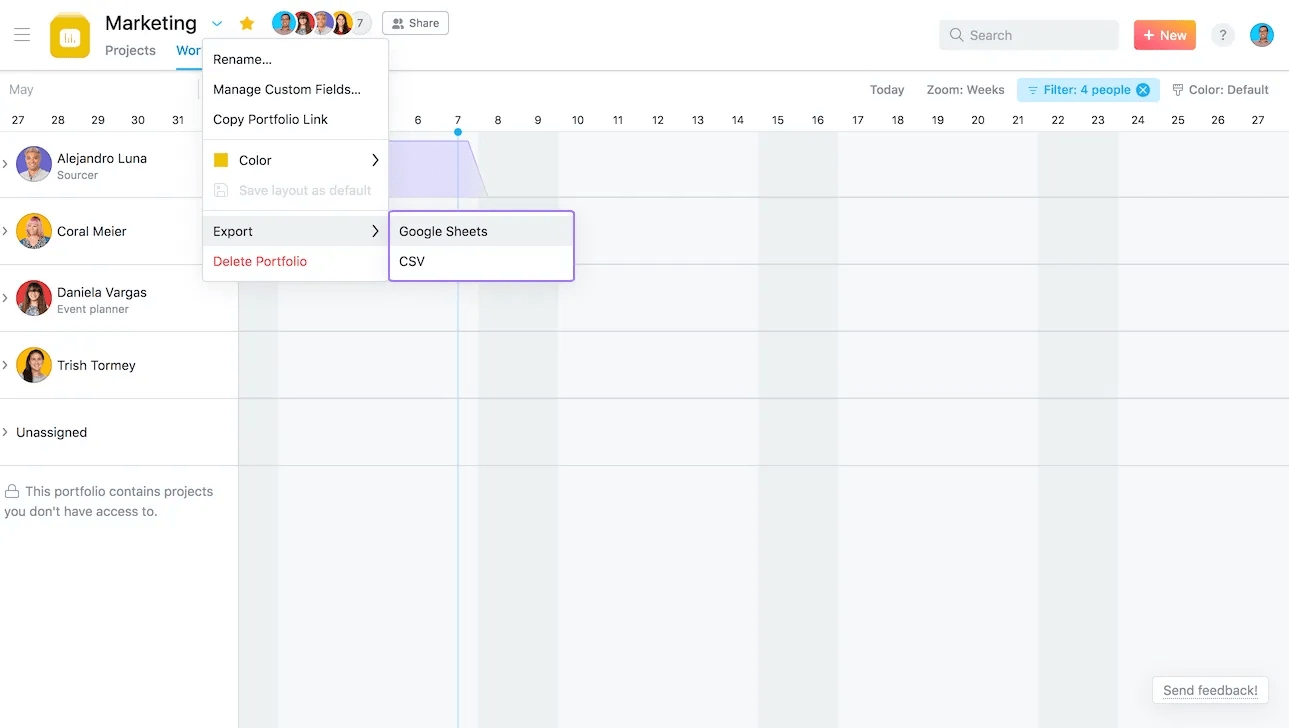
I Asana klickar du på Exportera/Skriv ut i den nedrullningsbara menyn intill projekt-/portfoliorubriken och väljer Synkronisera med Google Kalkylark. Google Kalkylark öppnas i en ny flik.
-
Kopiera URL: en som finns i modalen som följer.
-
3. Synkronisera dina Asana-data till ett nytt blad
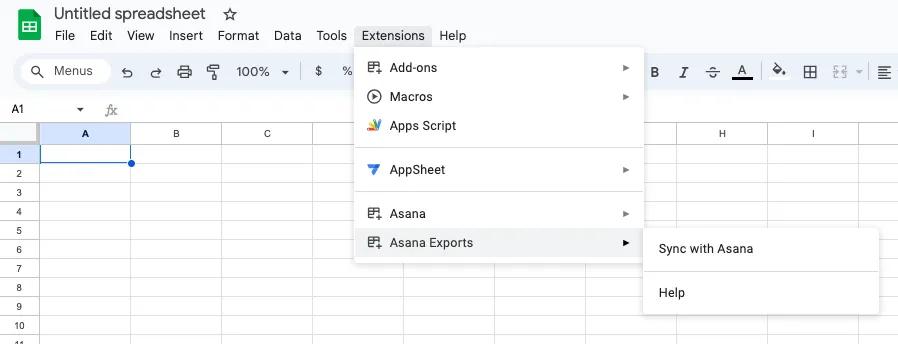
- Skapa ett nytt, tomt Google-ark
- Gå till flikenTillägg > Asana-exporter > Synkronisera med Asana
- Klistra in URL: en från steg 2 i inmatningsrutan och klicka på OK. Ditt blad synkroniseras med dina Asana-data.
Anteckning
Den nuvarande gränsen för synkronisering och export av data är 500 rader.
Portföljrapportering
Om du använder den här funktionen för första gången måste du auktorisera Asana att ansluta till ditt Google-konto.
Uppgifterna i ditt Google Kalkylark kommer automatiskt att uppdateras var sjätte timme.
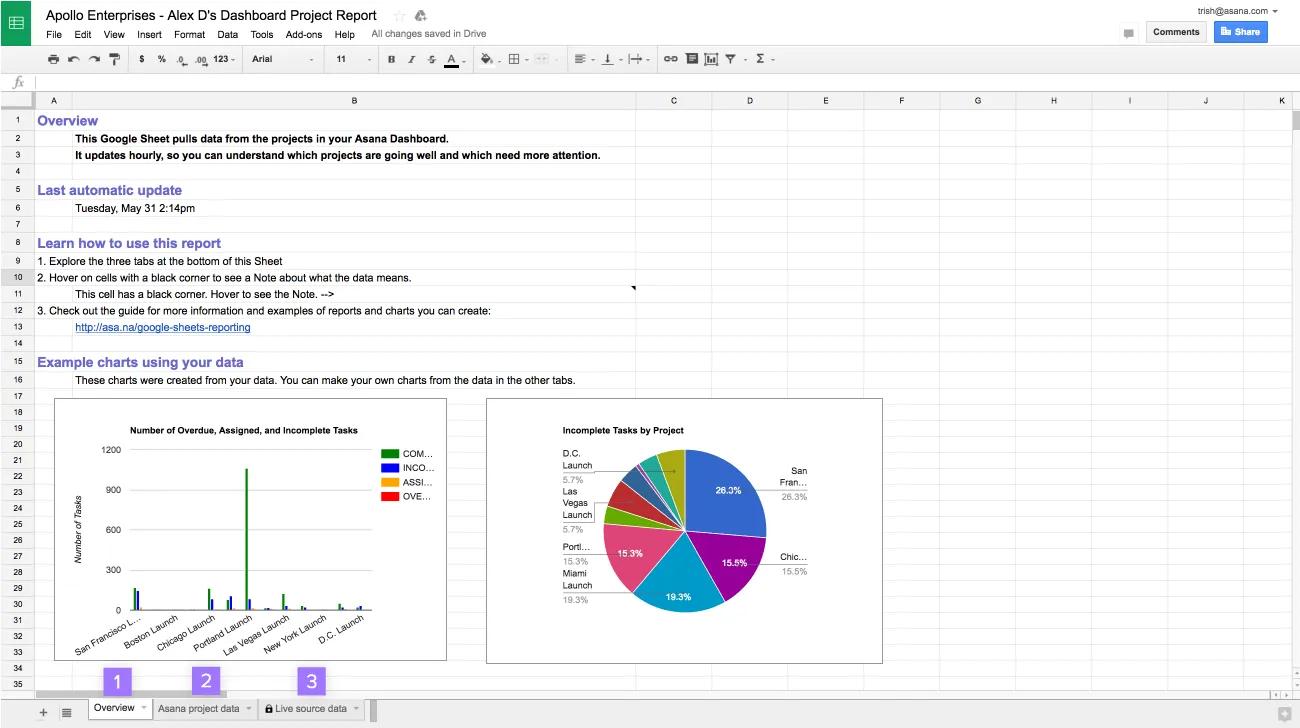
Google Kalkylark-rapporten har tre flikar:
- Översikt— en referens för hur man använder kalkylarket med två exempel på diagram som skapats från dina data.
- Asana-projektdata - visar den viktigaste informationen från varje projekt. Sortera och filtrera kolumnerna för att utforska informationen.
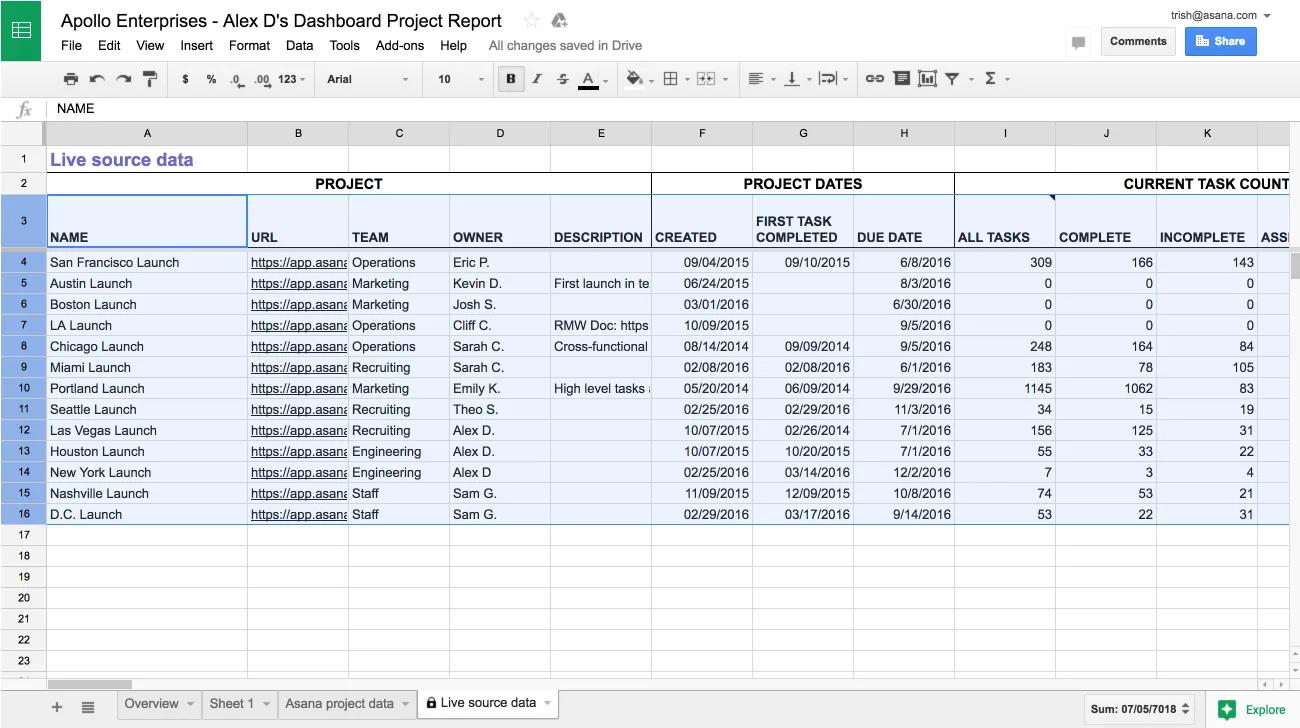
- Källdata i realtid - hämtar realtidsdata direkt från Asana. Den här fliken är låst för att skydda anslutningen till Asana.
Håll muspekaren över rubriken på kolumnerna för att lära dig mer om vilka data de innehåller.
Skapa anpassade rapporter
Exempel på rapporter att skapa i Google Kalkylark:
- Vilka projekt riskerar att bli fördröjda och förfaller snart? Ett punktdiagram med slutdatum och statusfärg.
- Vilka projektägare driver arbetet framåt snabbt? Ett stapeldiagram med de senast slutföra uppgifterna, per projektägare.
- Hur stor andel av dina projekt är i fas? Ett cirkeldiagram med statusfärger.
- Är arbetet fokuserat eller utspritt i flera projekt? Ett histogram med de uppgifter som slutförts under den senaste veckan i varje projekt.
- Vilka team har nästan slutfört sina projekt? Liggande stapeldiagram med slutförda projekt i % per team.
Exempel: Riskfyllda projekt som snart förfaller
Det här exemplet visar hur du skapar en rapport för att hitta de projekt som behöver din uppmärksamhet.
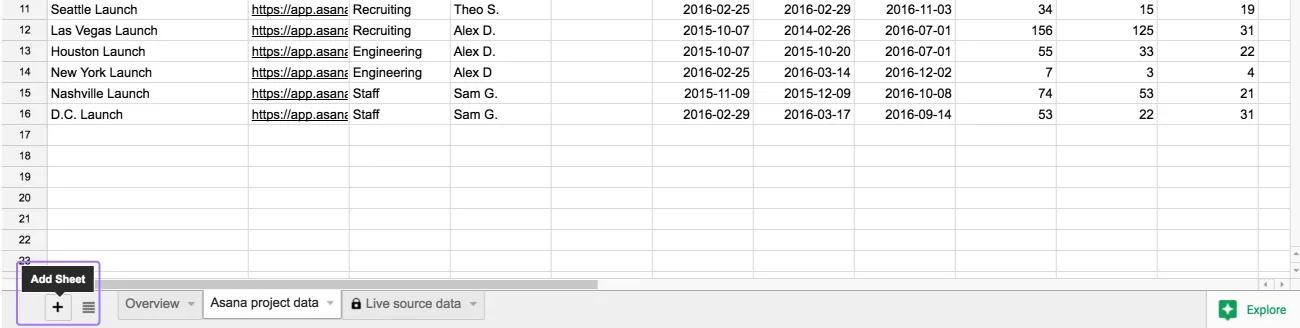
Skapa en ny flik
-
- Klicka på + -ikonen längst ned till vänster på ditt kalkylark för att skapa en ny flik.
- Välja ett namn för din rapport.
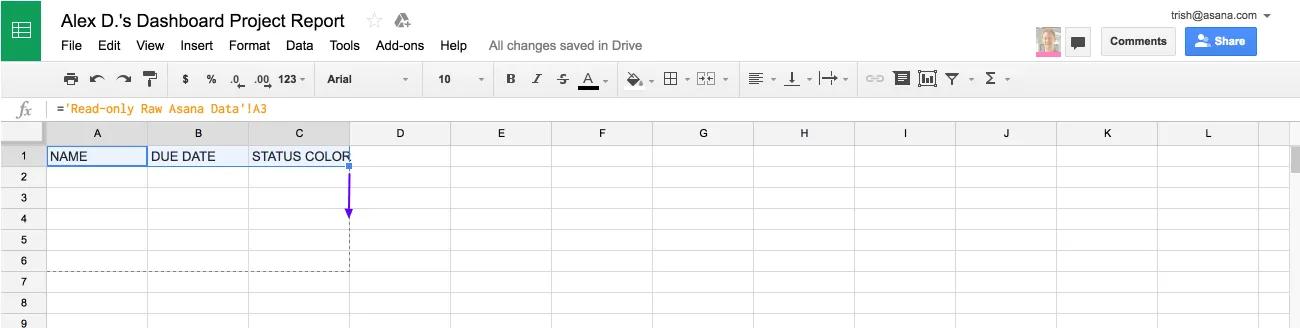
Referera till fliken med källdata i realtid för att lägga till kolumner i din rapport.
- Välj cellen längst upp till vänster i den nya tomma fliken och skriv
=. - Navigera till fliken med källdata i realtid. Klicka på rubriken på kolumnen du vill kopiera. I det här exemplet använder vi kolumnen Namn.
- Tryck på
Retur. Detta kommer att ta dig tillbaka till fliken med din rapport.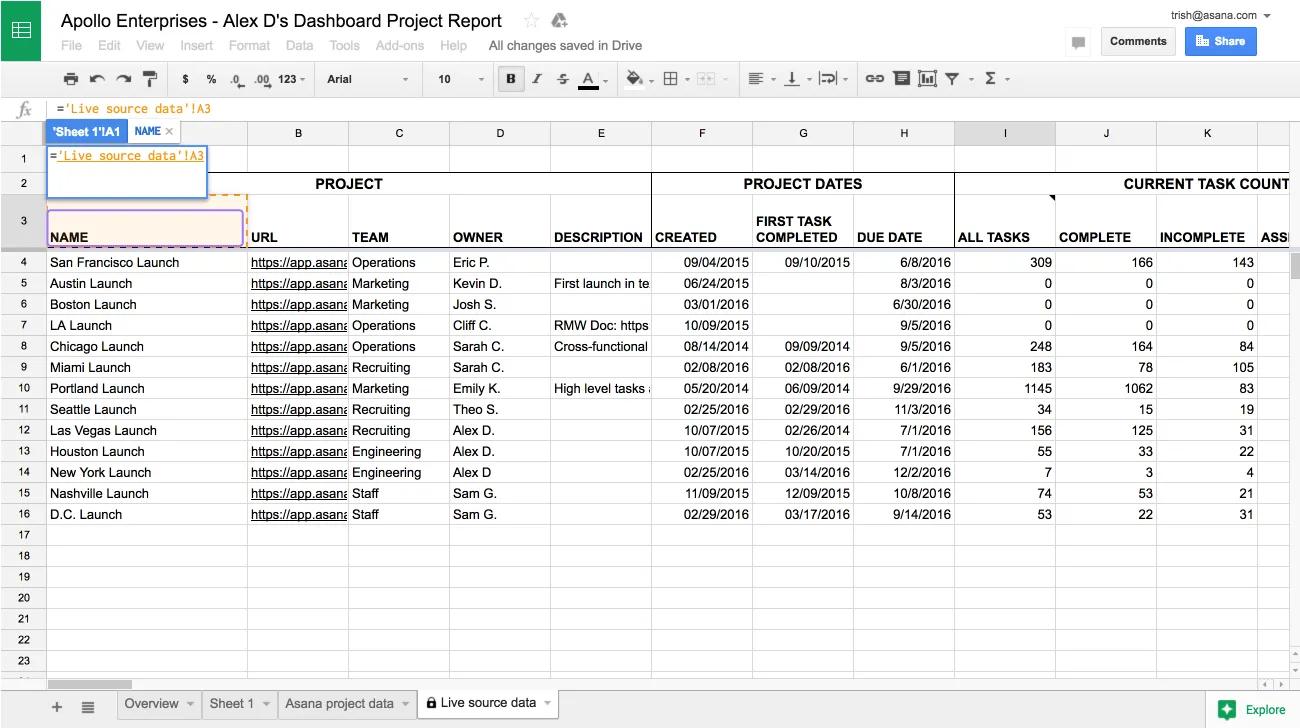
- Välj nästa cell till höger och upprepa steg 2 och 4 för kolumnerna Slutdatum och Statusfärg.
- När rubrikcellen i varje kolumn har refererats kan data kopieras över. Markera de tre rubrikerna och använd autofyll-handtaget i det nedre högra hörnet av din markering och att dra det nedåt.
Vi refererade till data i fliken Källdata i realtid i stället för att bara kopiera de. Det innebär att när data i fliken Källdata i realtid uppdateras automatiskt varje timme, uppdateras även din rapport.
Använd en formel för att beräkna den tid som återstår fram till deadline för varje projekt
- Ange
DAGAR INNAN SLUTDATUMsom rubrik till den fjärde kolumnen. - Ange formeln
=DATEDIF(NOW(), B2, "D")nedan. Detta beräknar antalet dagar mellan nu och värdet i kolumnen Slutdatum.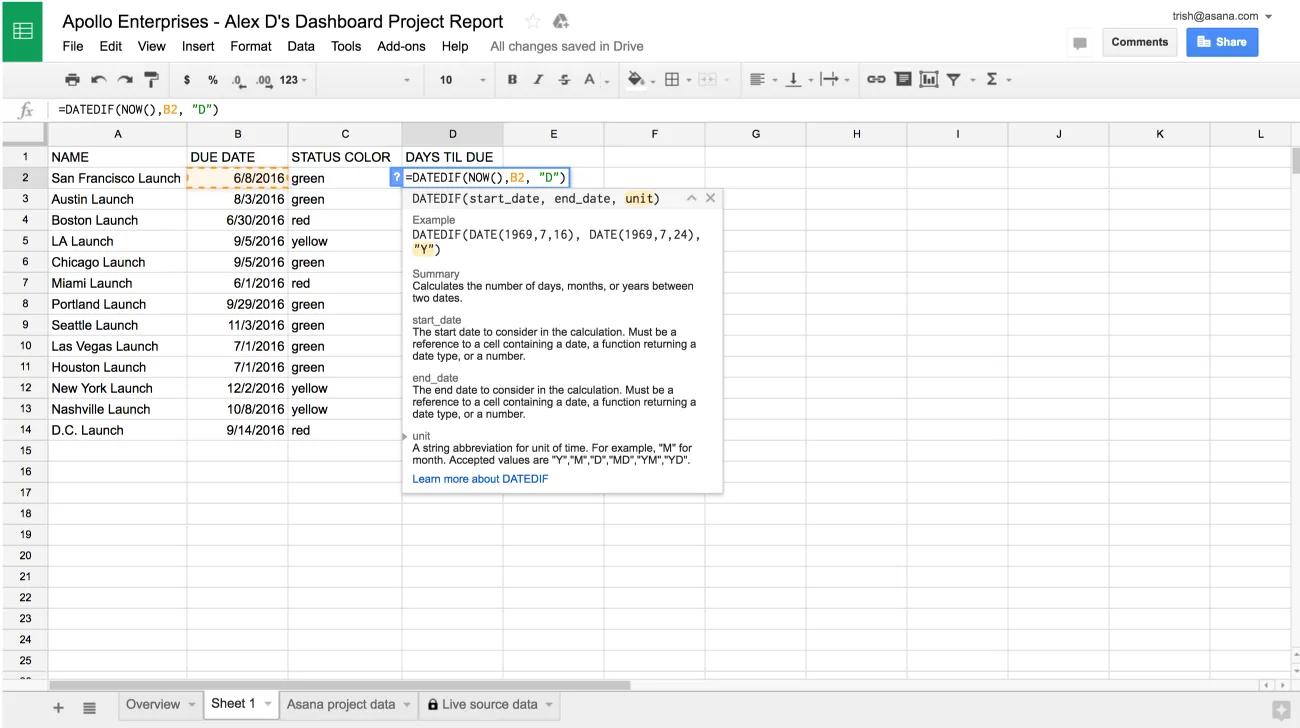
- Dra ned autofyll-handtaget för att fylla i resten av kolumnen.
Skapa ett punktdiagram
- Sortera rapporten efter statusfärg genom att öppna menyn Data och välja Filter. Använd menyn på kolumnrubriken Statusfärg för att Sortera A → Ö.
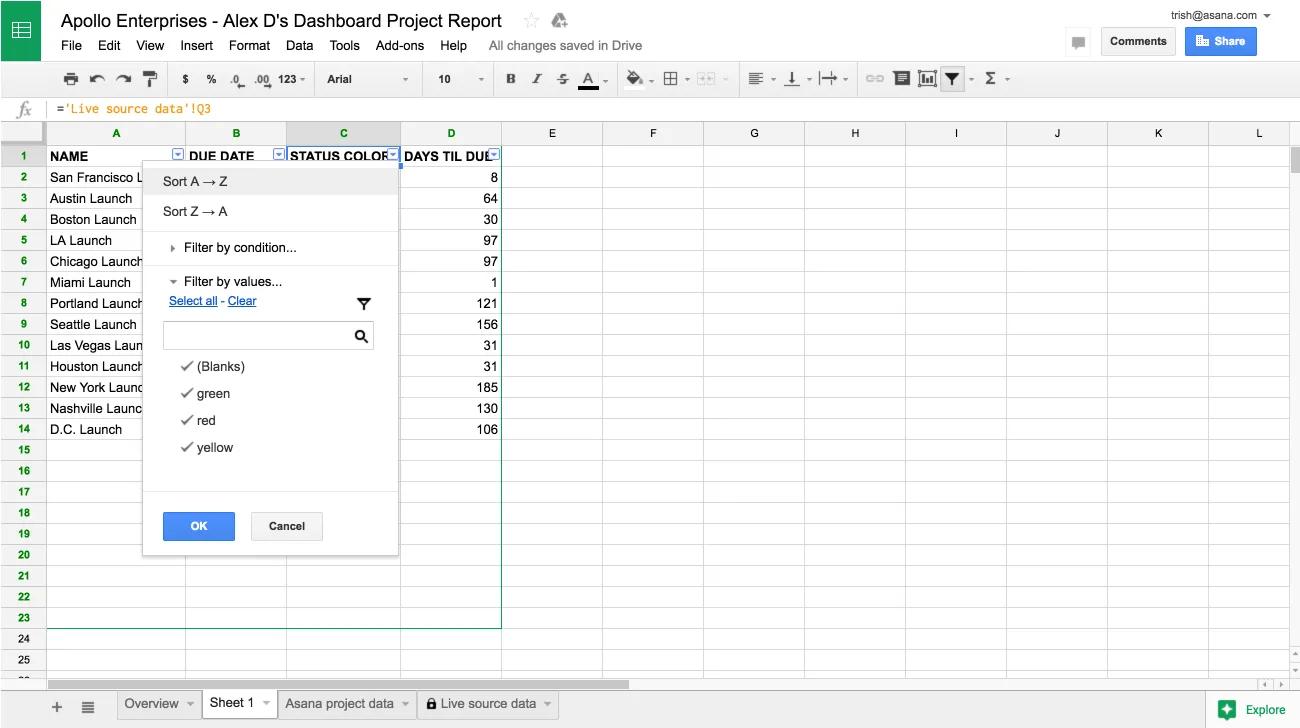
- Välj kolumnerna Statusfärg, Dagar innan slutdatum och Namn i den här ordningen genom att hålla ned
⌘(på Mac) ellerCTRL(på PC) och klicka på bokstaven ovanför varje kolumn (C, D och A). Dessa tre kolumner behövs i punktdiagrammet och kolumnen Namn måste väljas sist eftersom den fungerar som etikett för varje datapunkt.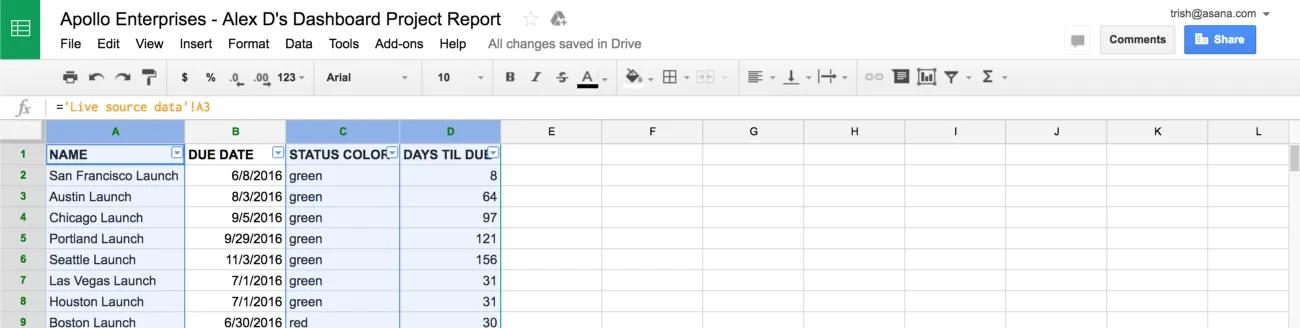
- Öppna menyn Infoga och välj Diagram för att skapa ett diagram.
- Välj ett punktdiagram och avmarkera Mängd i kolumn C.
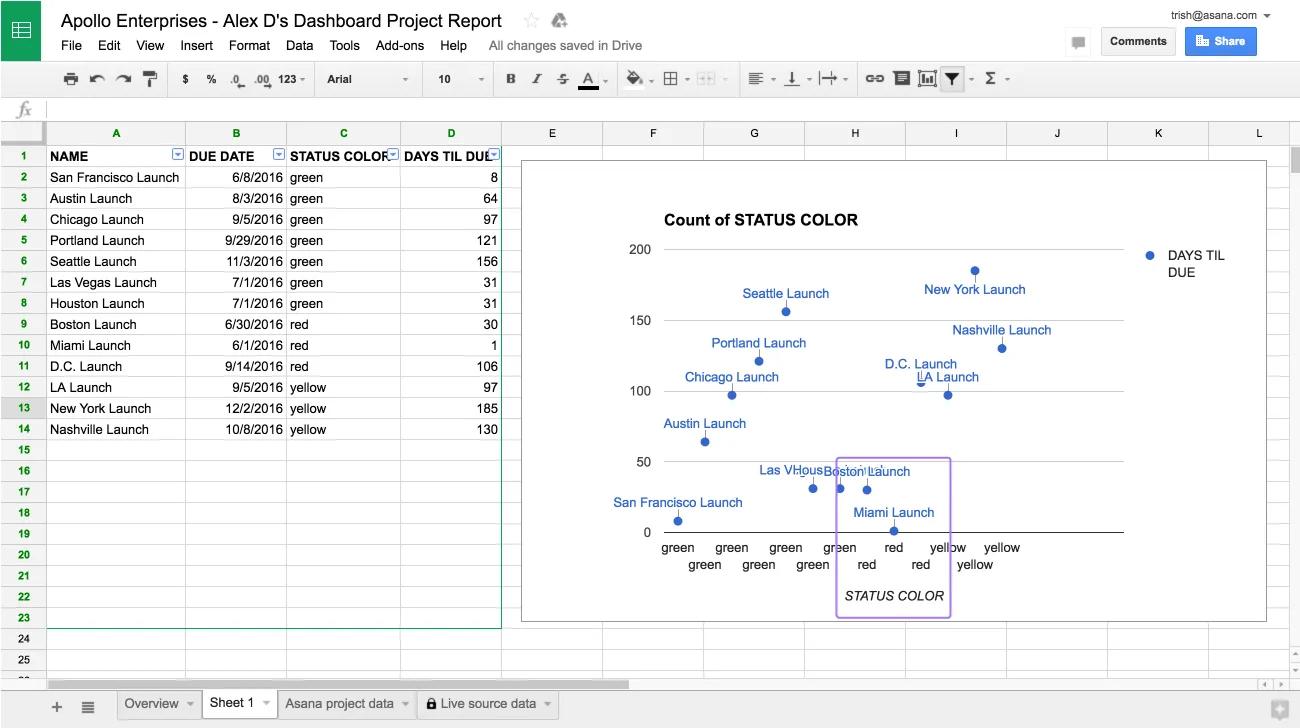
Använd det här diagrammet för att identifiera vilka projekt som är i riskzonen. I skärmbilden nedan är projekt i riskzonen alla projekt som är röda och förfaller inom 60 dagar. Eftersom data uppdateras varje timme kan du ofta referera till det här diagrammet för att avgöra vilka projekt teamet bör fokusera på.
Exempel: Uppgifternas slutförandegrad efter projektägare
Det här exemplet visar hur du skapar en rapport där projekt grupperas efter en egenskap, i det här fallet efter projektägare. Använd den här rapporten för att identifiera antalet uppgifter som har slutförts den här veckan i projekt som drivs av varje projektägare.
Skapa en pivottabell för att gruppera projekt efter ägare
- Navigera till fliken med källdata i realtid.
- Välj rader. Hoppa över rad 1 eftersom en pivottabell fungerar bäst när den första raden innehåller rubrikerna.
- Öppna menyn Data och välj Pivottabell. Detta öppnar en ny flik som heter Pivottabell.
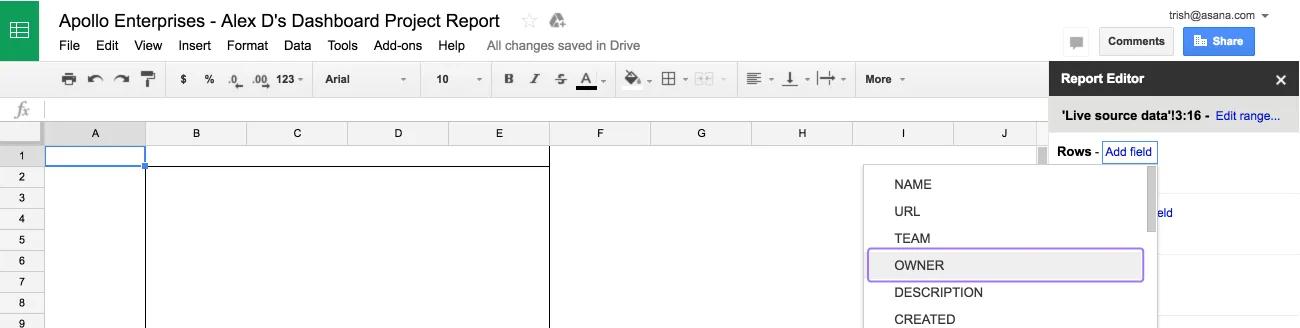
- I fliken Pivottabell, i sidofältet Rapportredigerare, under Rader, väljer du Lägg till fält. Välj kolumnen där du vill gruppera dina projekt, i det här fallet Ägare. Avmarkera Visa summor, den här informationen behövs inte i det här exemplet.
- Under Värden väljer du Lägg till fält. Välj kolumnen du vill undersöka för varje projektgrupp - i det här fallet Slutförda uppgifter.
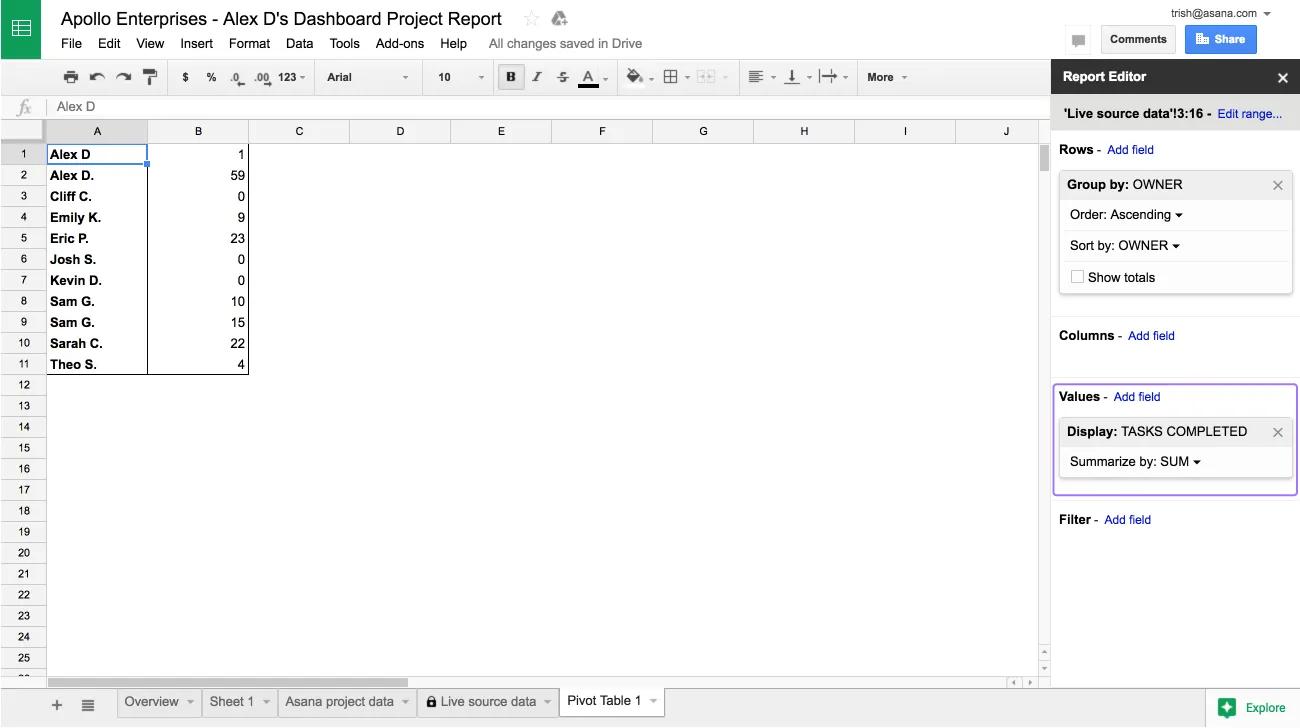
- Kontrollera att gruppens värden sammanfattas efter behov. I det här exemplet vill vi se den totala slutförandegraden för uppgifterna i varje projektgrupp, så vi väljer Summa.
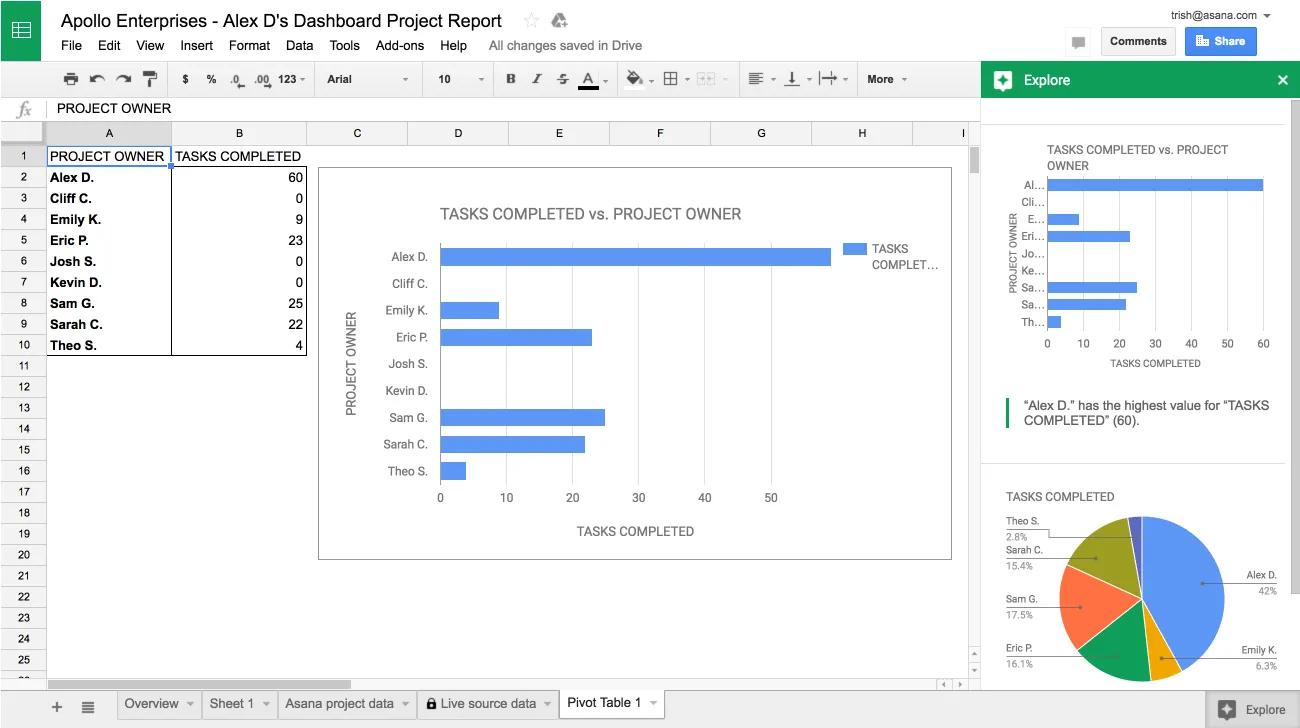
Visualisera informationen
Använd sidofältet Utforska i Google Kalkylark, som genererar relevanta diagram med hjälp av artificiell intelligens.
- Klicka på Utforska längst ned till höger i kalkylarket. I det här exemplet använder vi ett stapeldiagram för att visualisera uppgifternas slutförandegrad.
- Om du vill förstora diagrammet kan du dra det till tabellens huvudområde. Högerklicka på diagrammet för att anpassa det.
 Rapporterna du skapar sparas automatiskt och visas nästa gång du öppnar kalkylarket i Asana.
Frågor om Google Kalkylark-integrering? Fråga communityn.
This article has been AI-translated.
Send translation feedback.